Configure Event-Driven to pass extra variables to Ansible Automation Platform
What is in this break-fix
In this section, we will send a curl to Event-Driven Ansible (Automation Decisions). Event-Driven Ansible (Automation Decisions) needs to run the Jobs Template: rh1-aap-extra-vars-eda
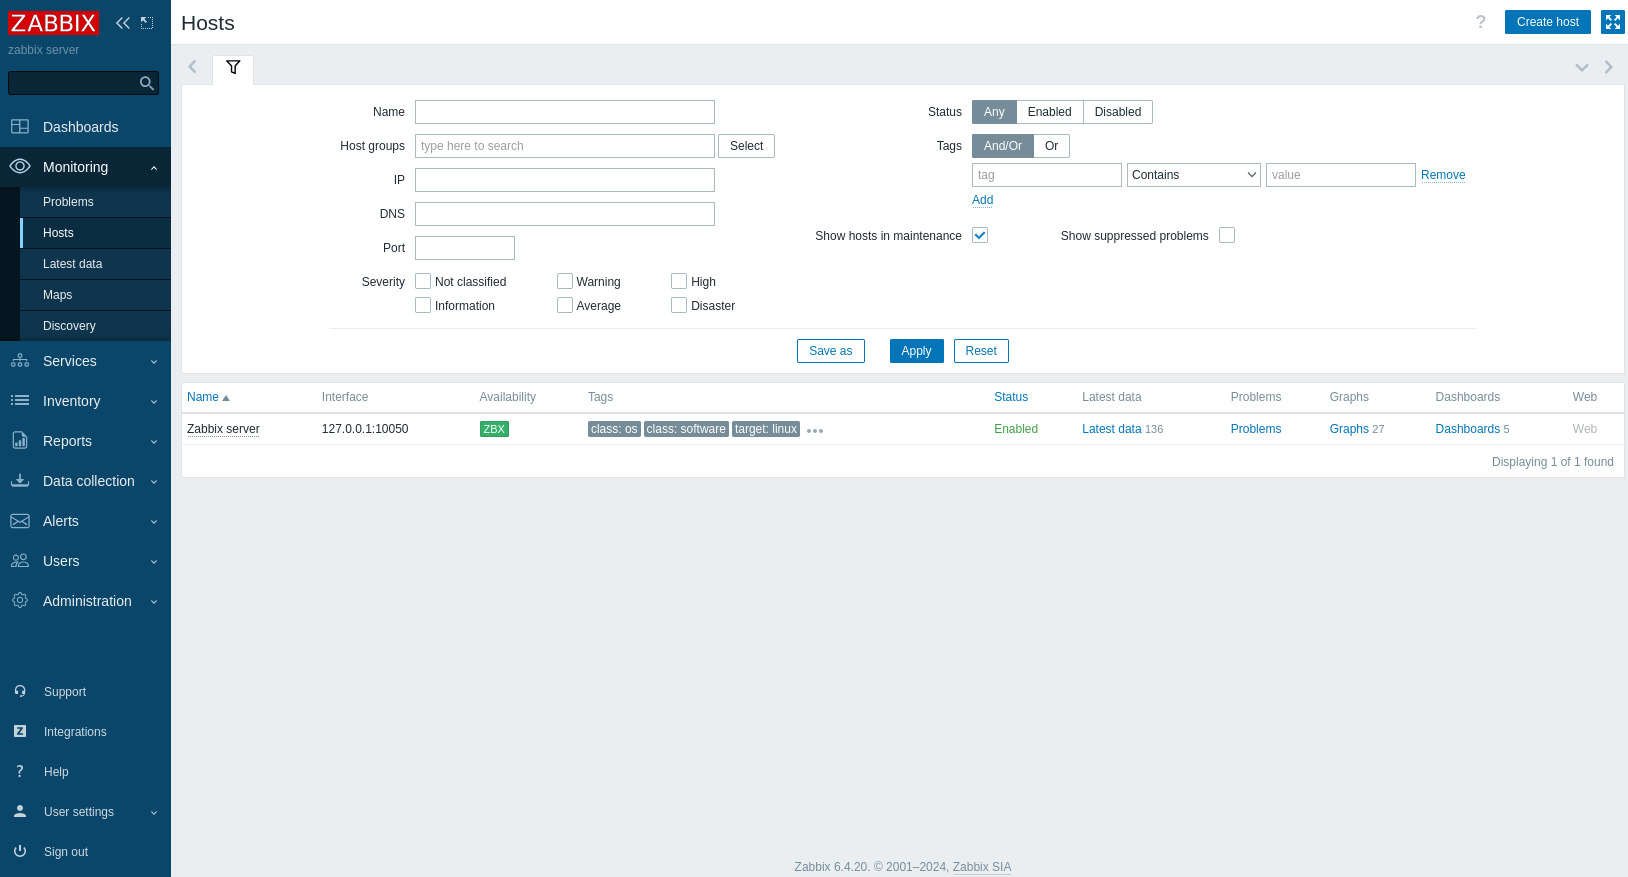
Add a node in Zabbix:
Run the client-zabbix playbook on the Ansible Automation Platform to configure the Zabbix agent on the host apache001. Log in to Zabbix: http://server.{subdomain_base}/zabbix/.
User: Admin
Pass: zabbix
Go to :
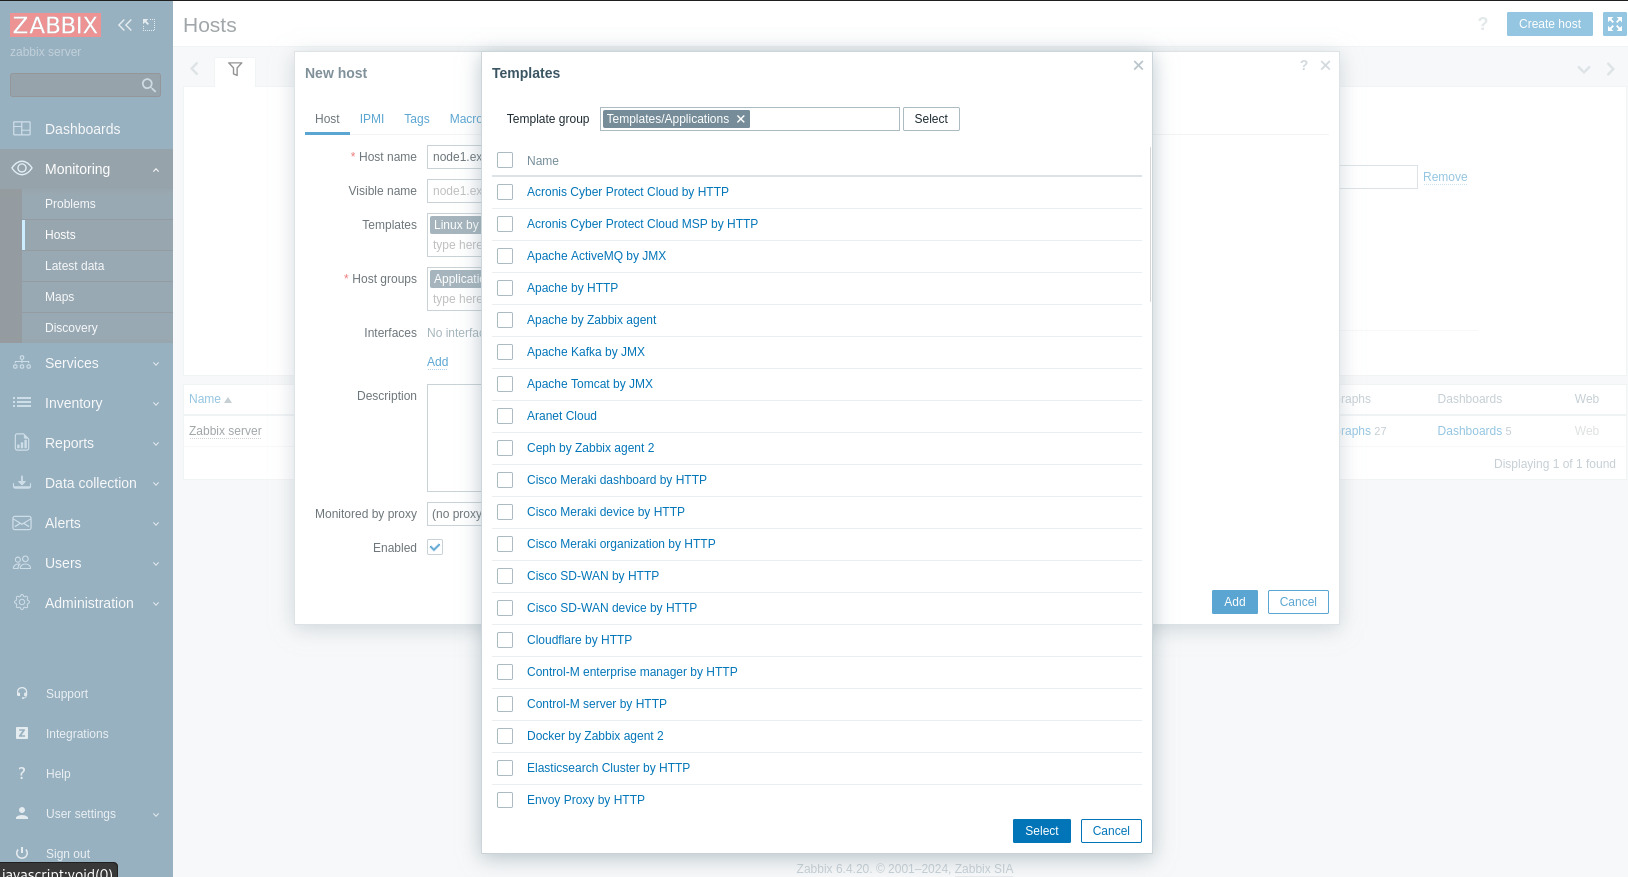
Click Create host:
Host name: node1.example.comFrom the Templates line, click Select.
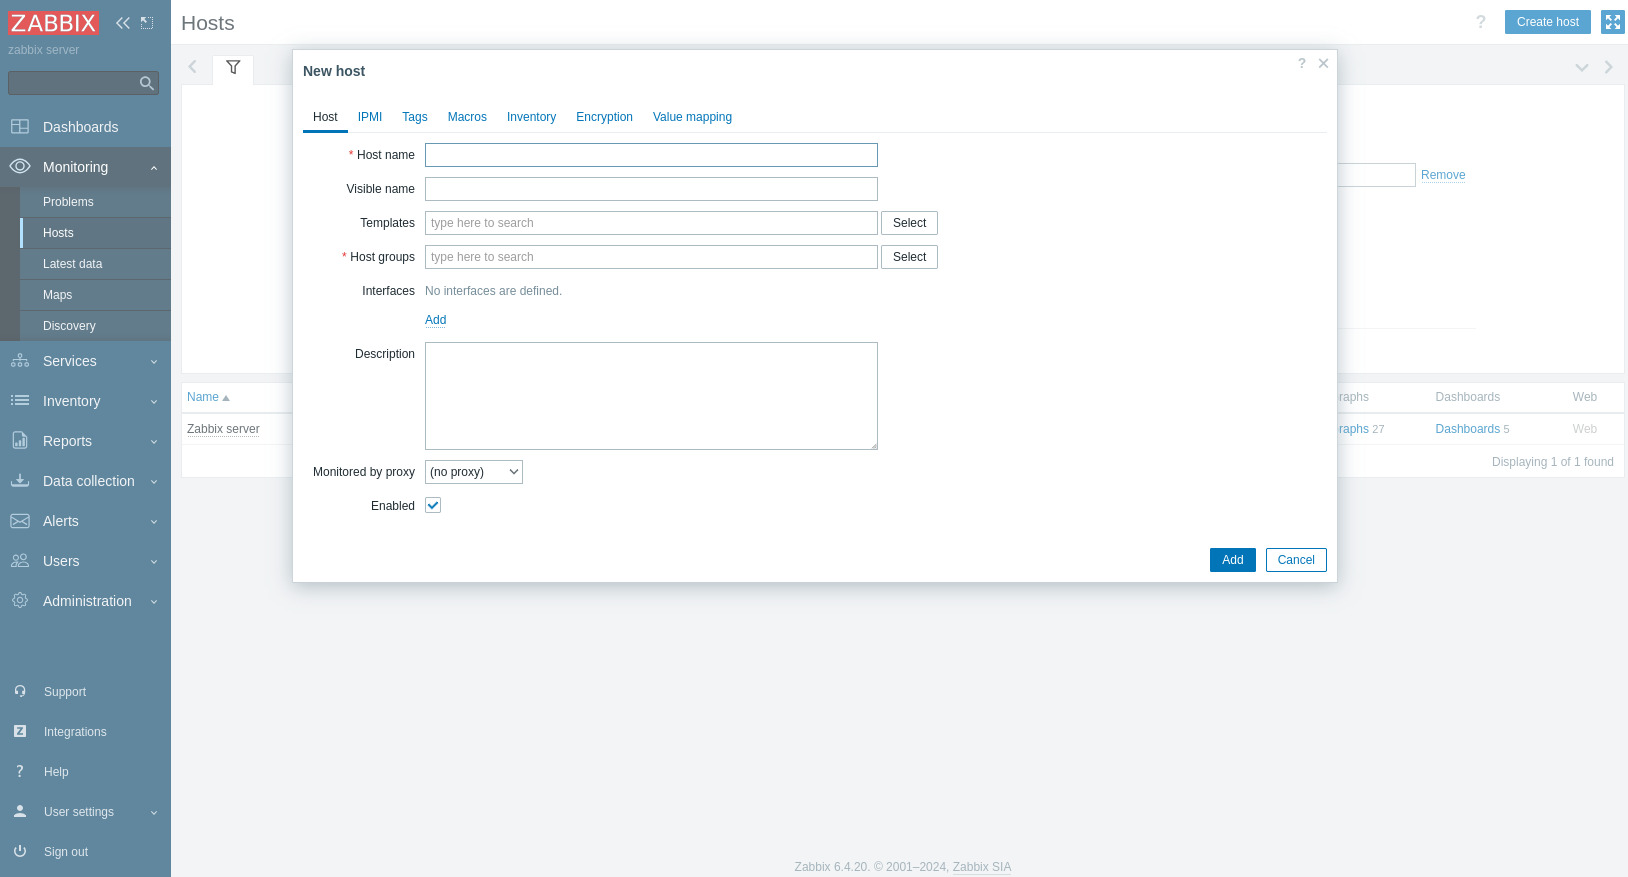
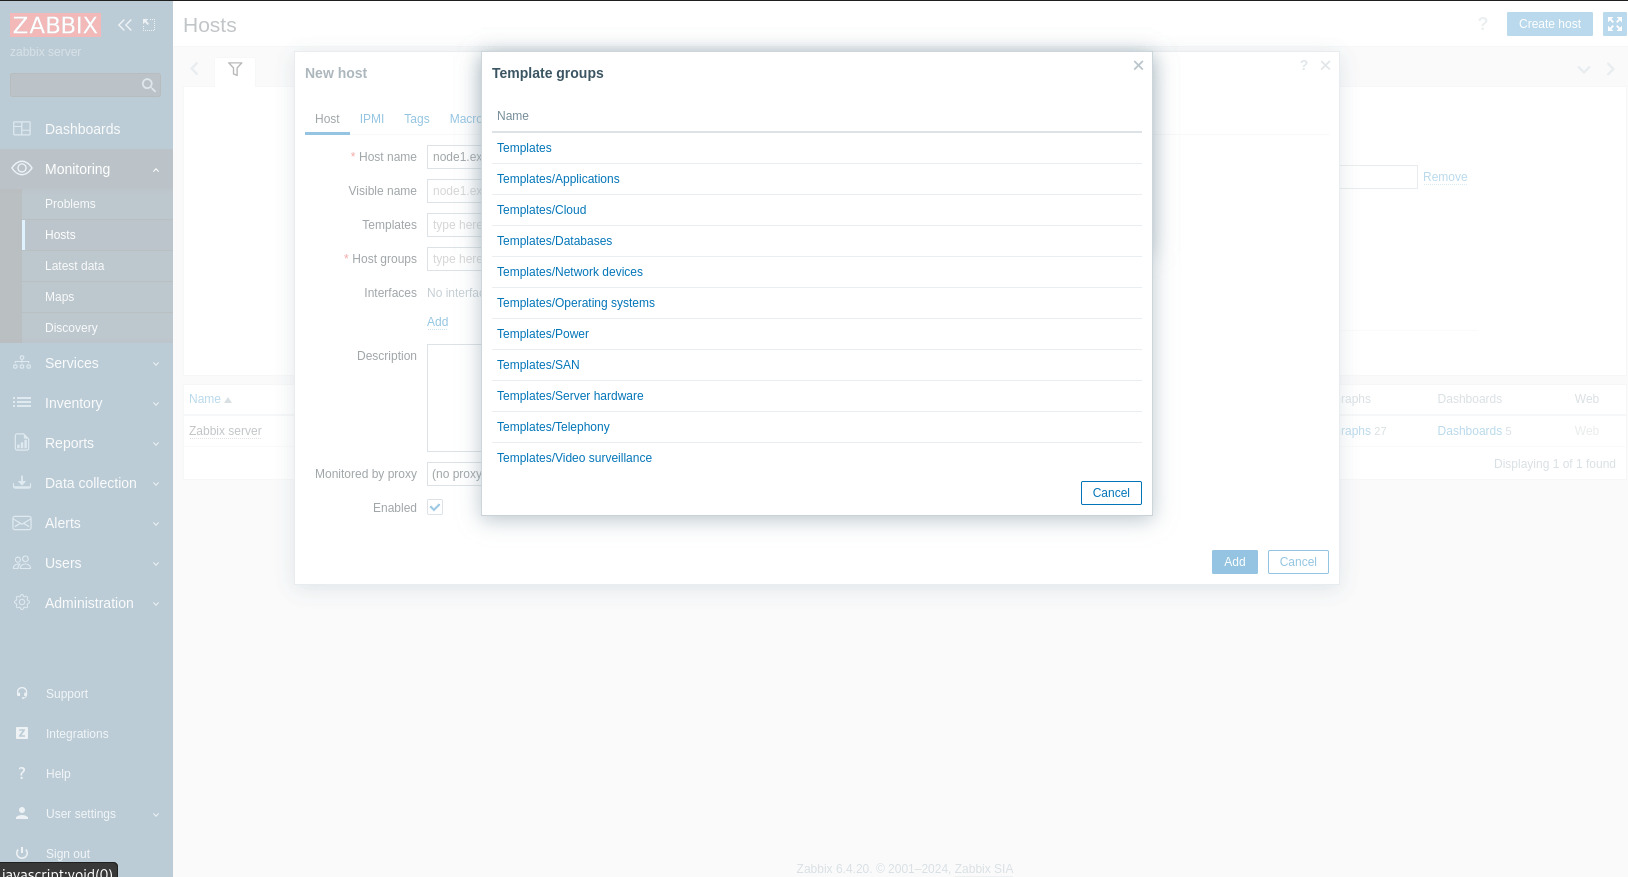
Click Select again:
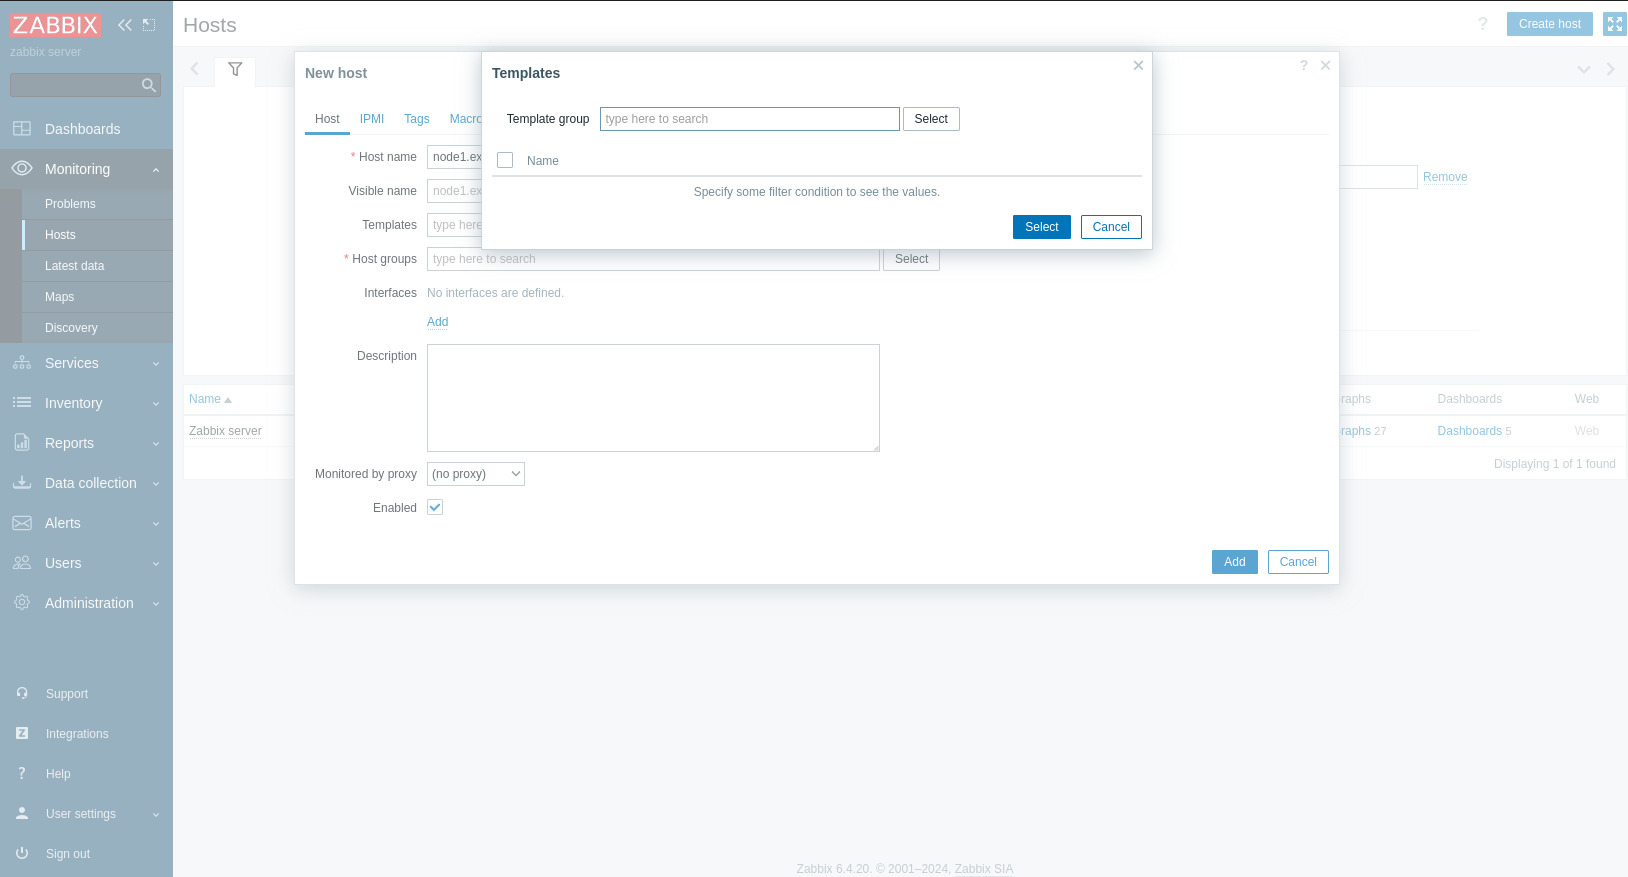
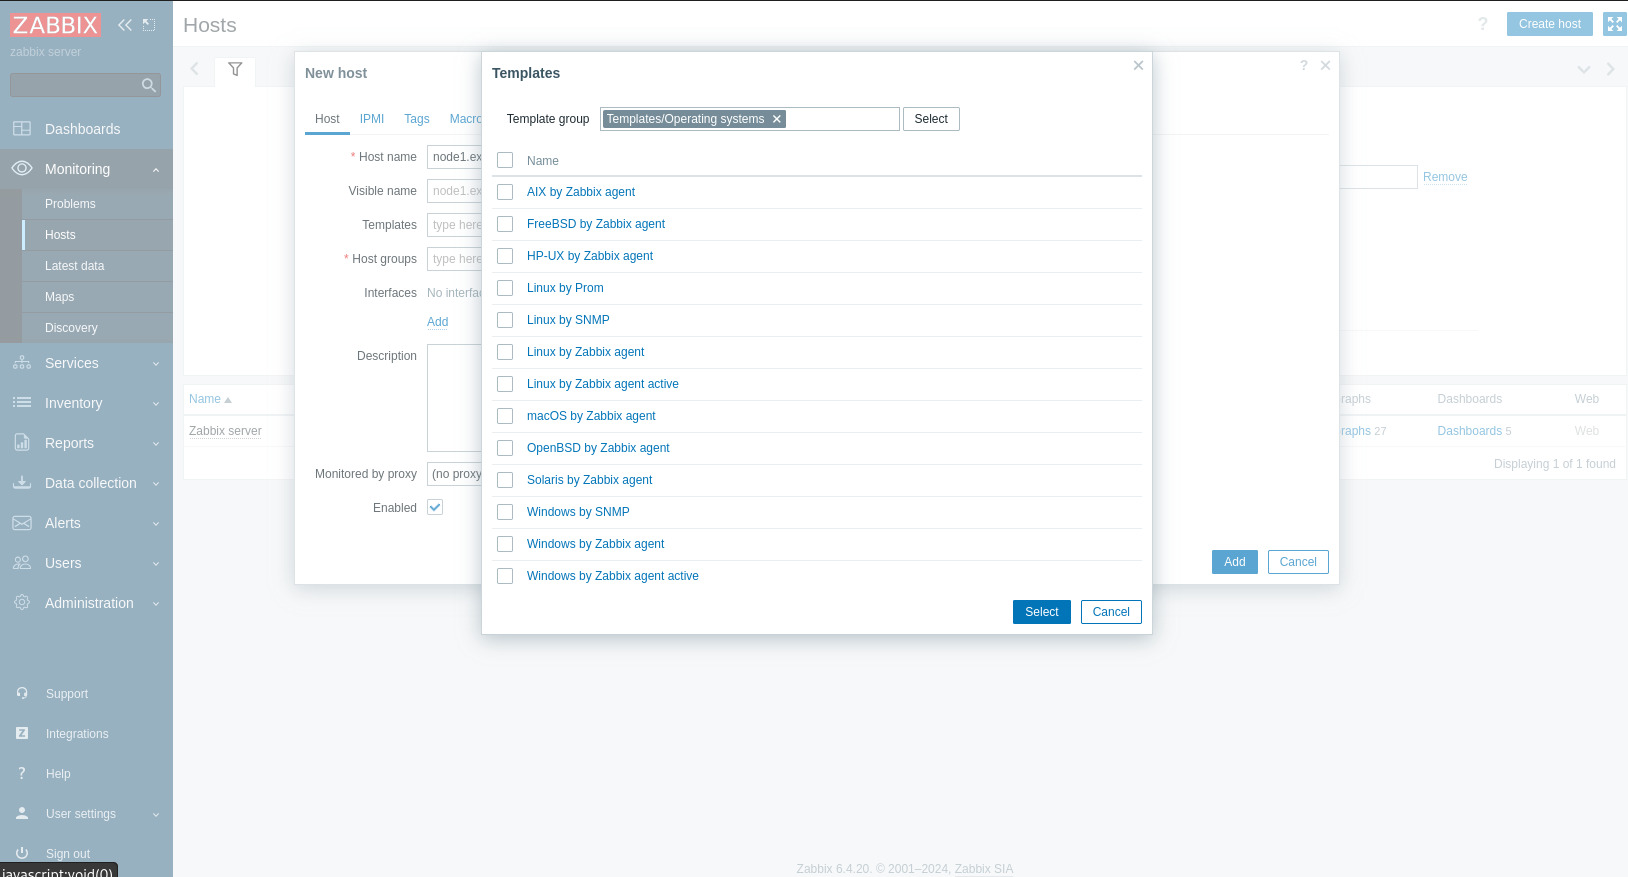
From the list, select Templates/Operating Systems:
Then, select Linux by Zabbix agent
Click Select to confirm your selection:
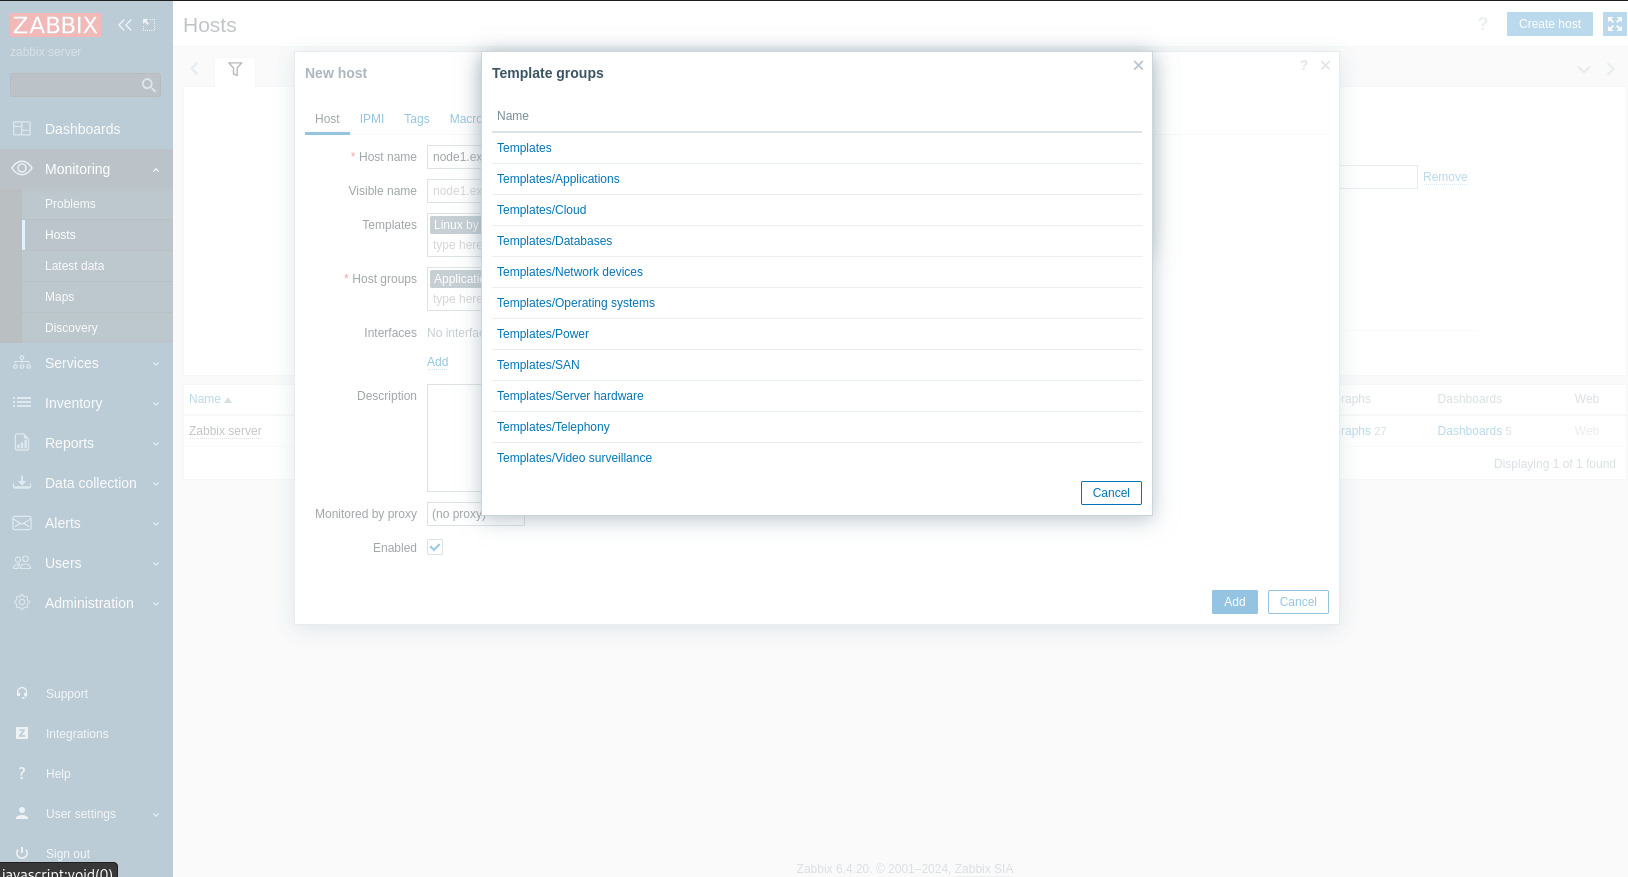
Next, add another template. On the Templates line, Click Select:
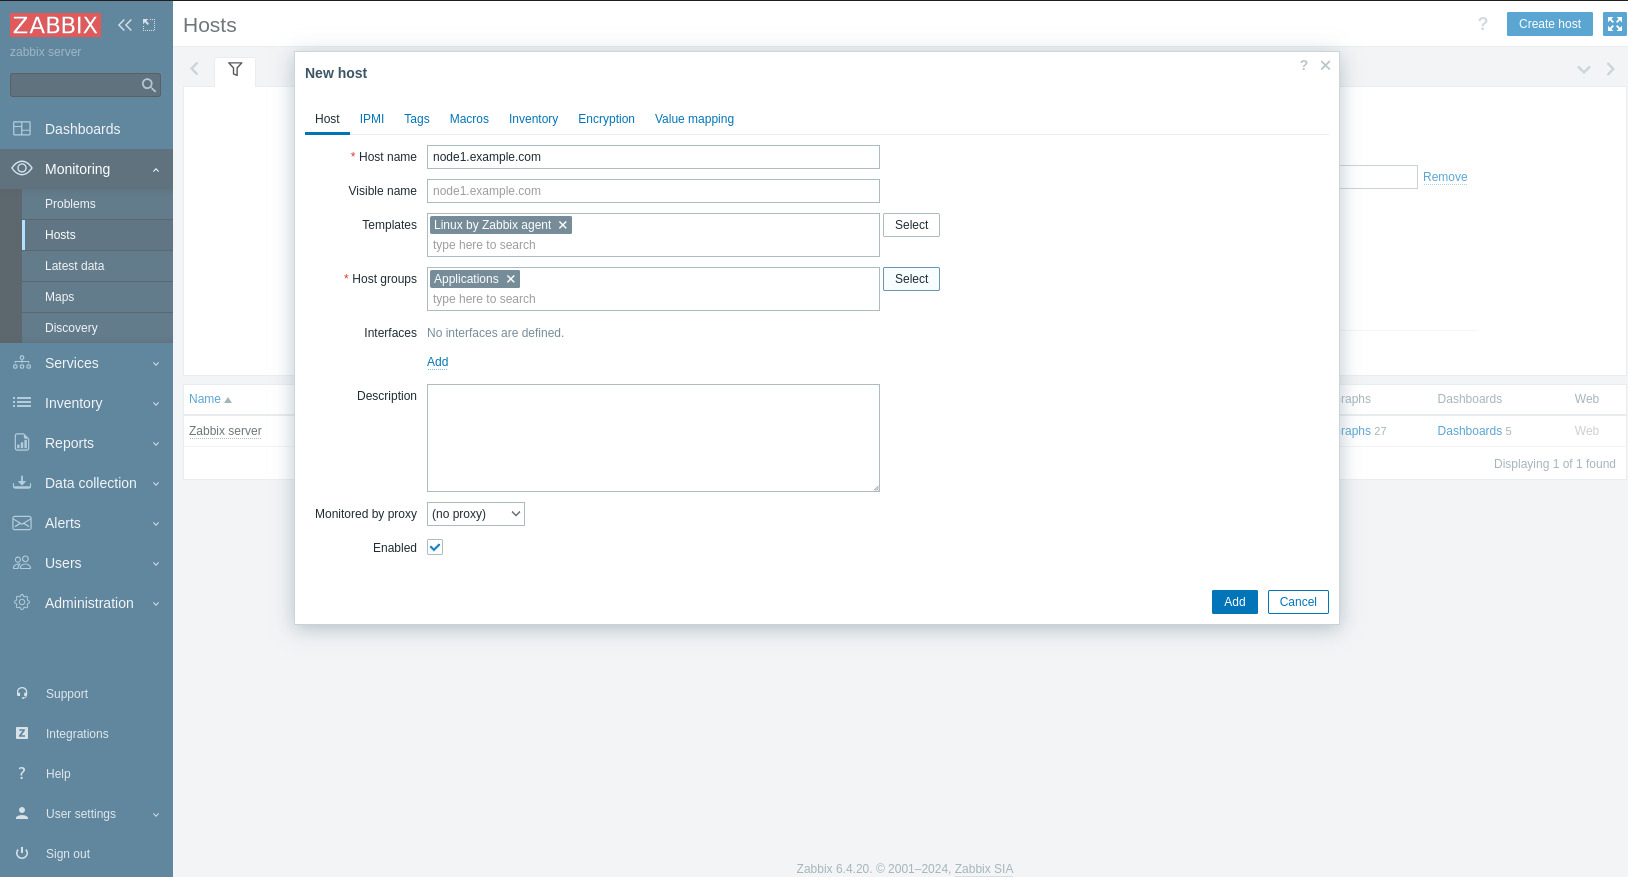
Click Templates/Applications
Then, select Apache by Zabbix agent
In Host groups, click Select and select Applications
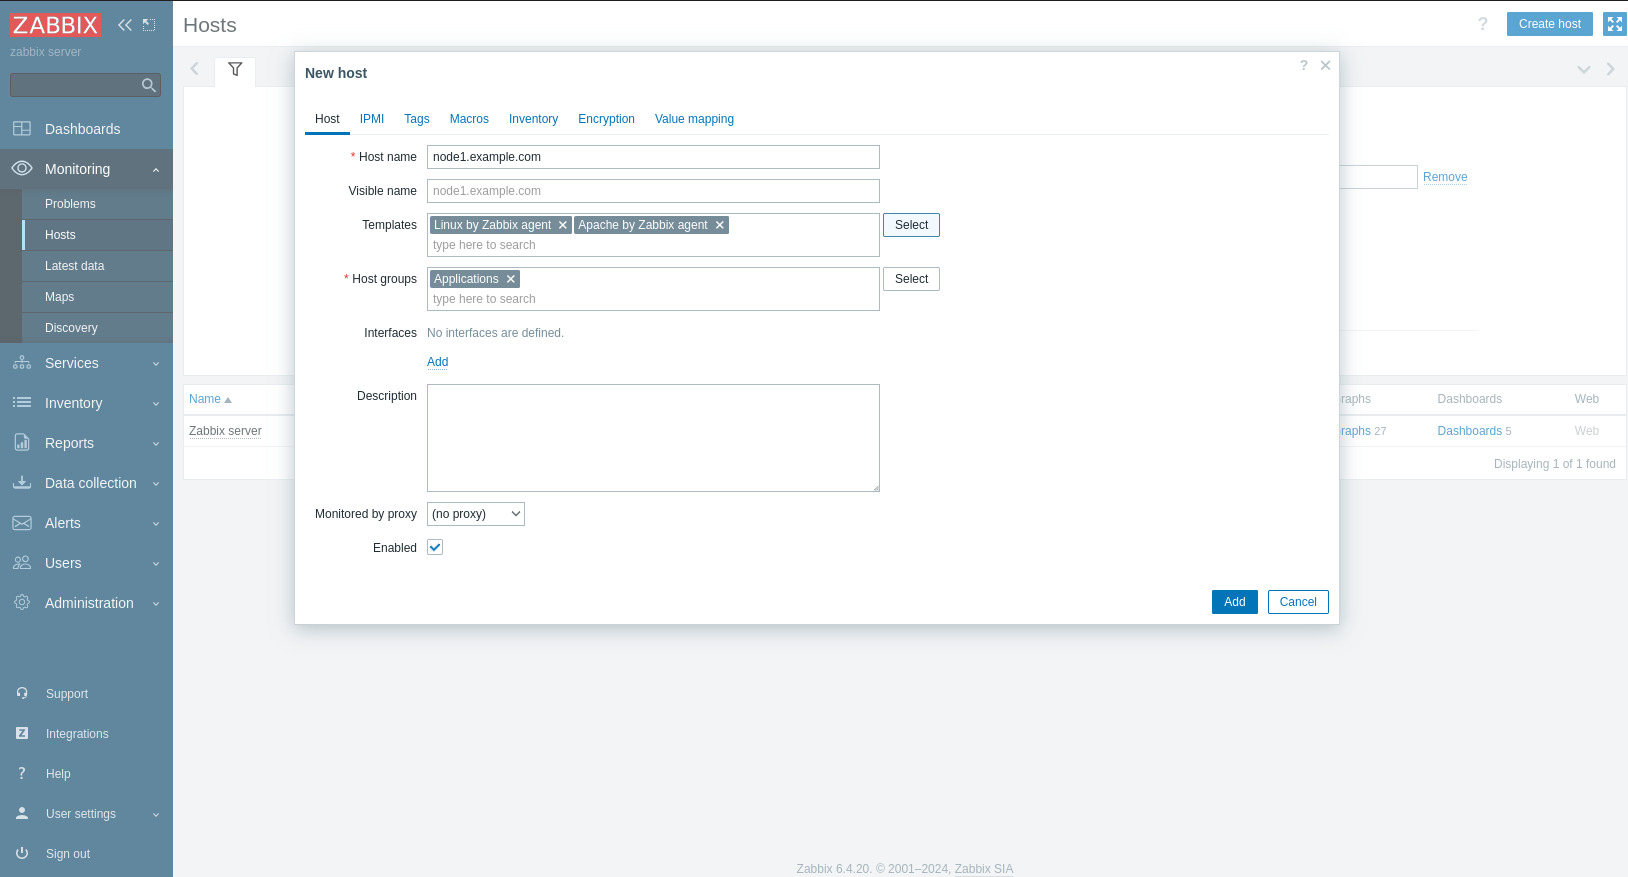
Just below Interfaces, click Add, and then click agent.

In the Connect to field, change to DNS: (IMPORTANT)
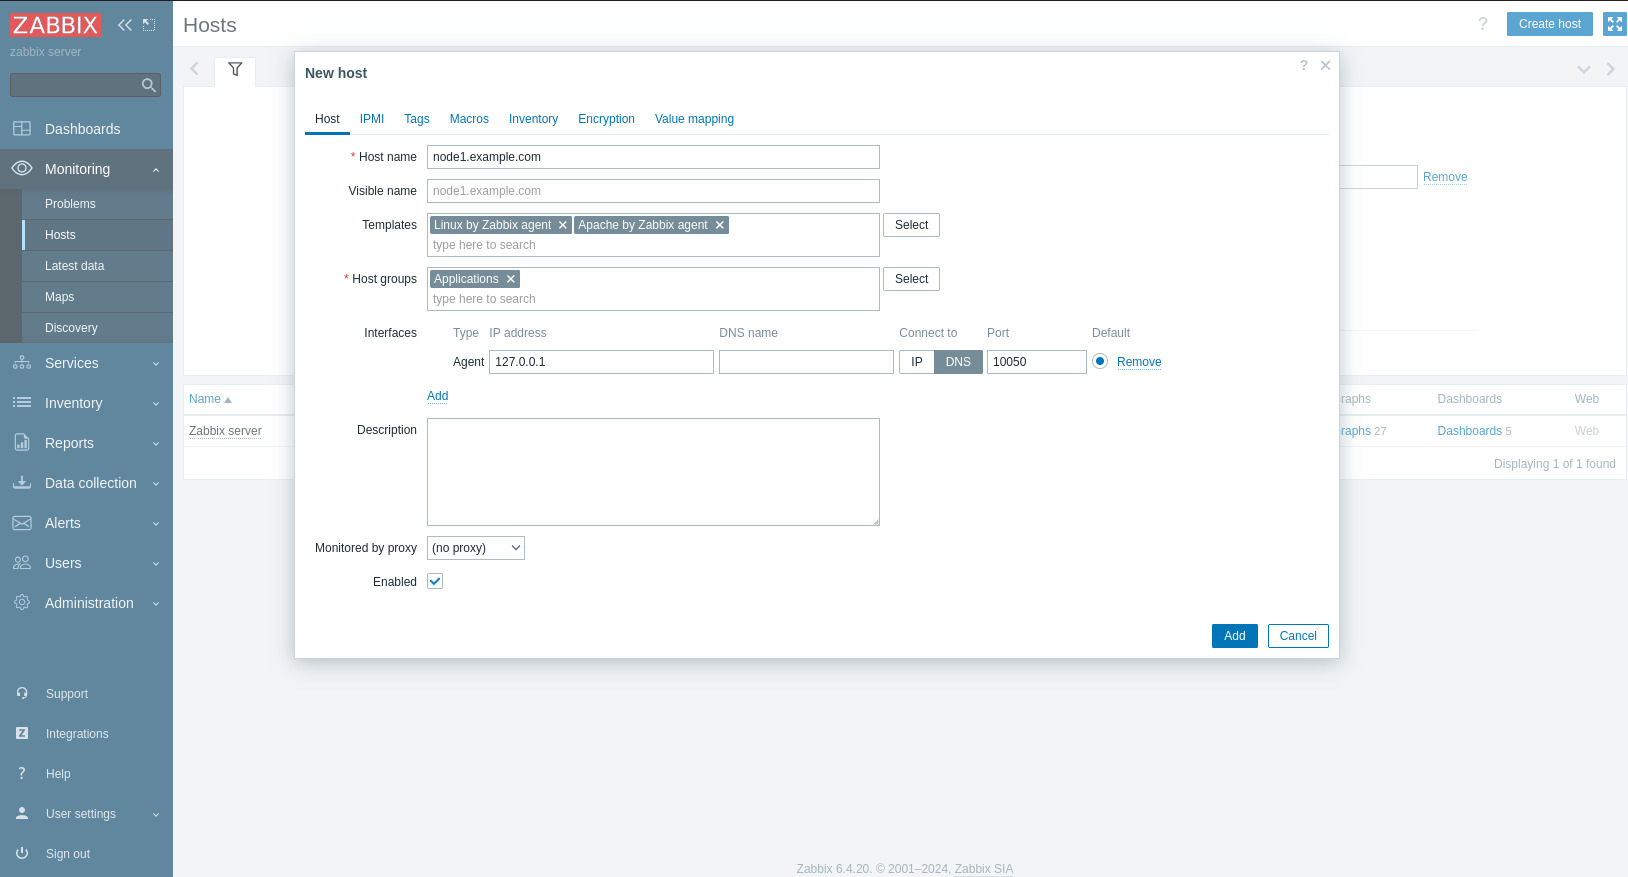
Add (in bold) node1.example.com to the DNS name field:
DNS name: node1.example.com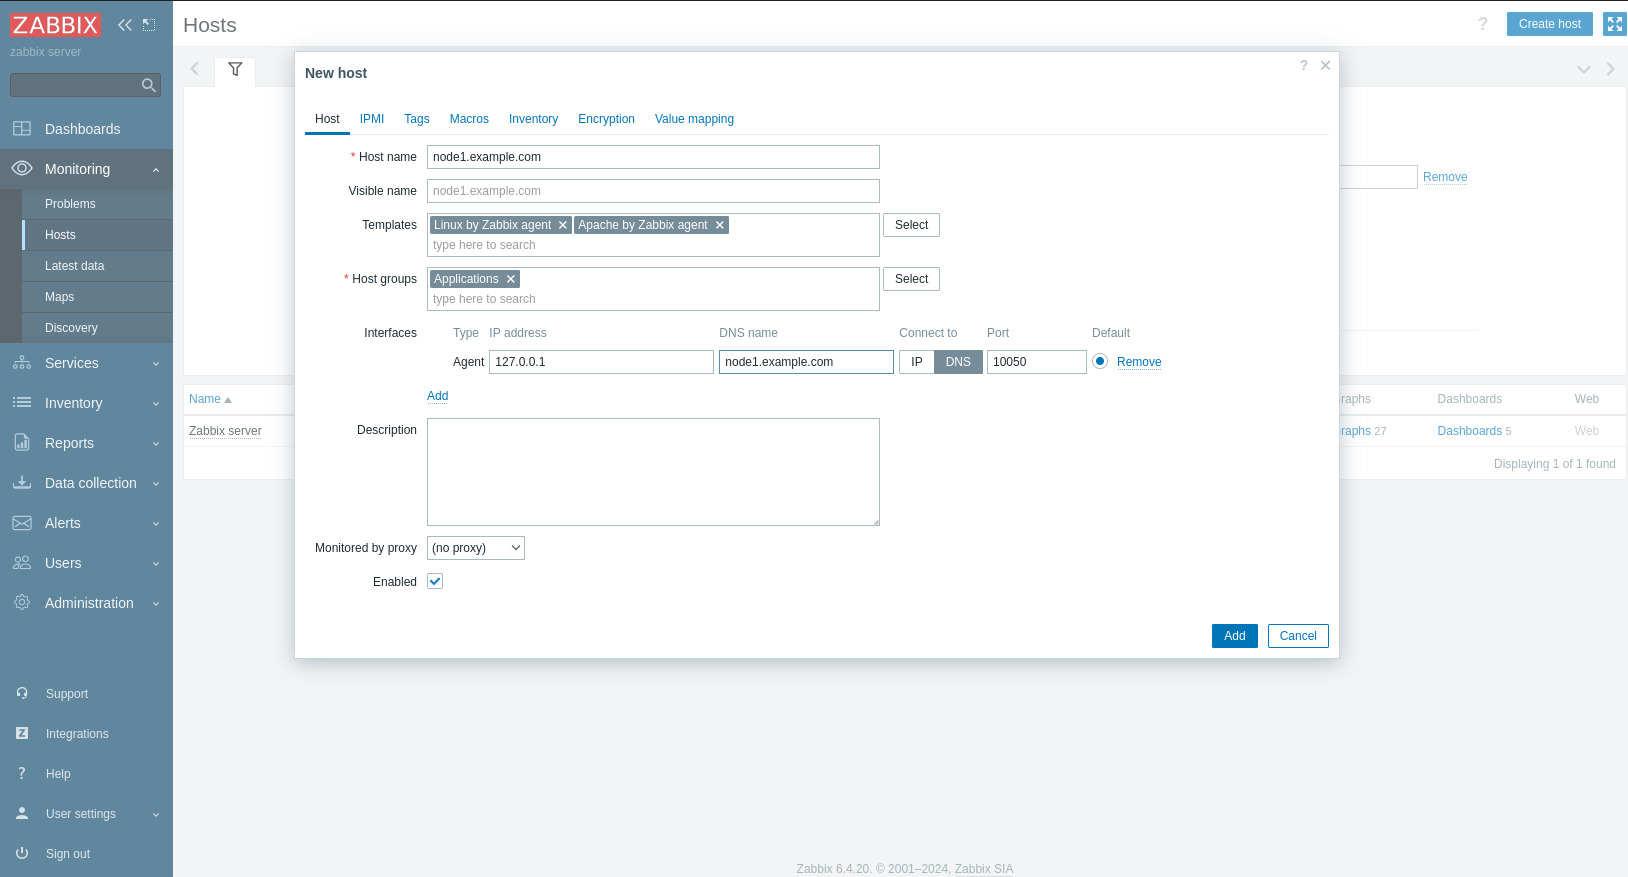
Now click Add on the bottom right of the page.
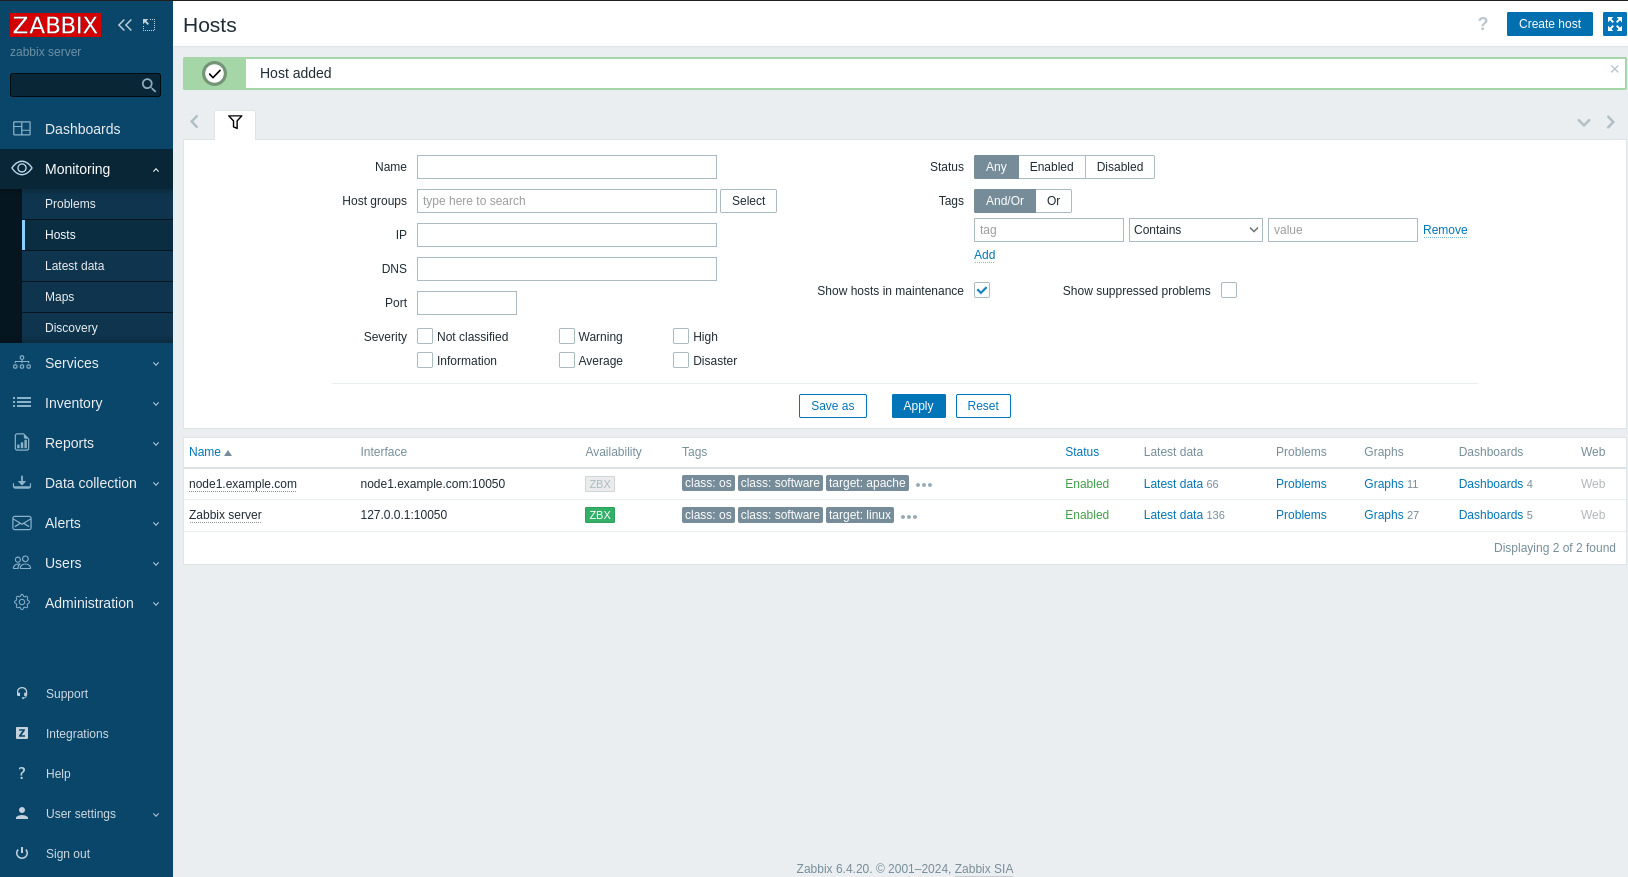
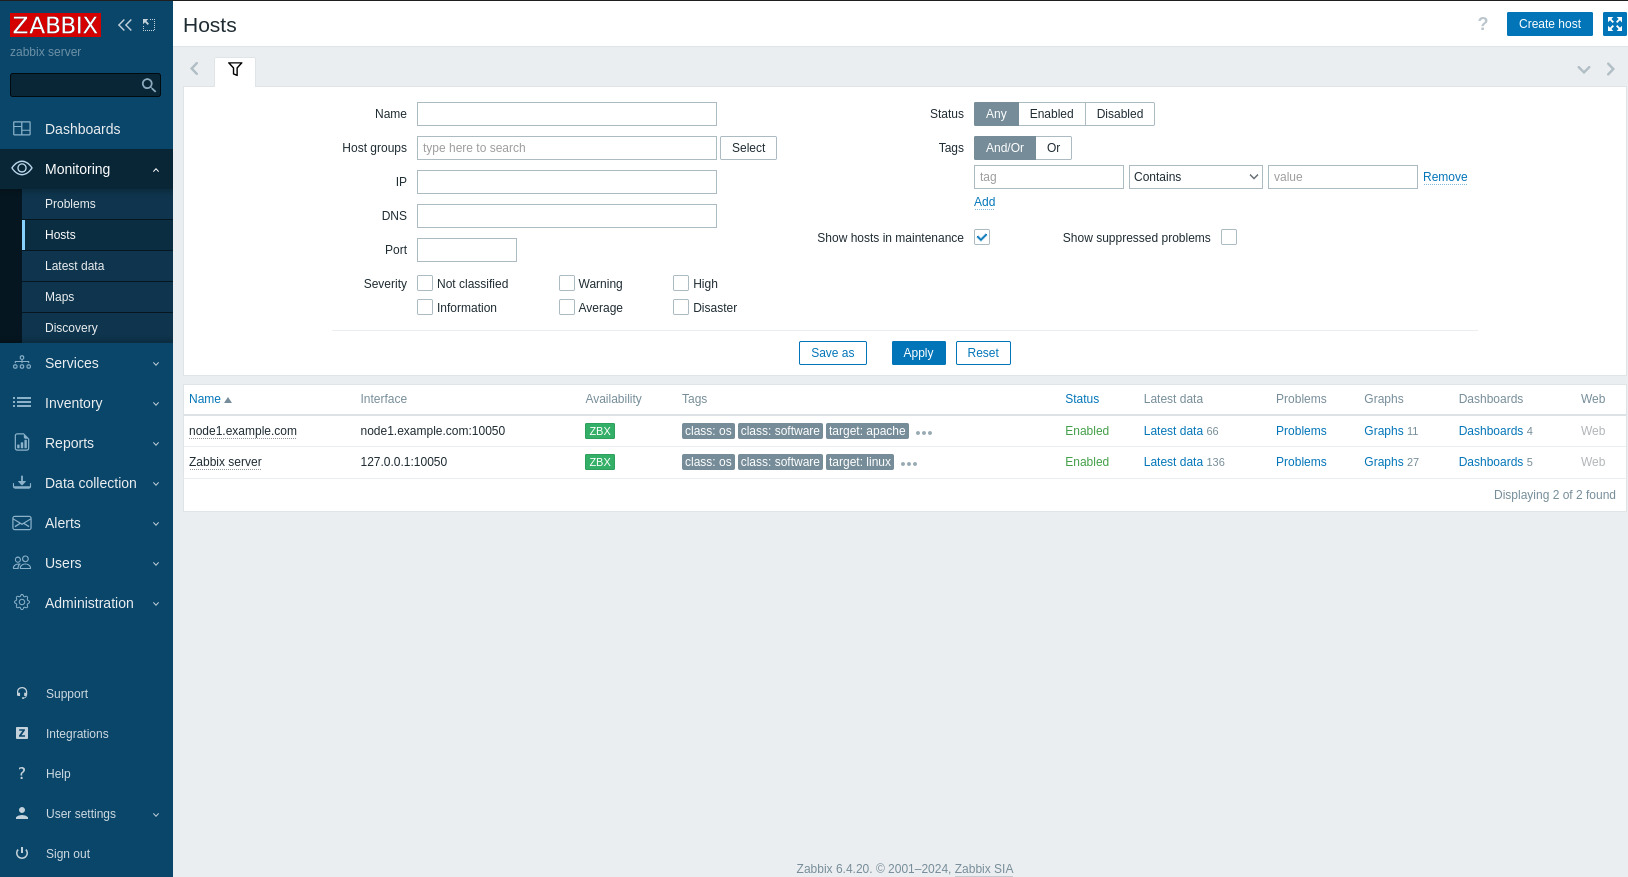
Wait 15 seconds. Press F5 to refresh the browser. When Availability turns green, everything is OK.
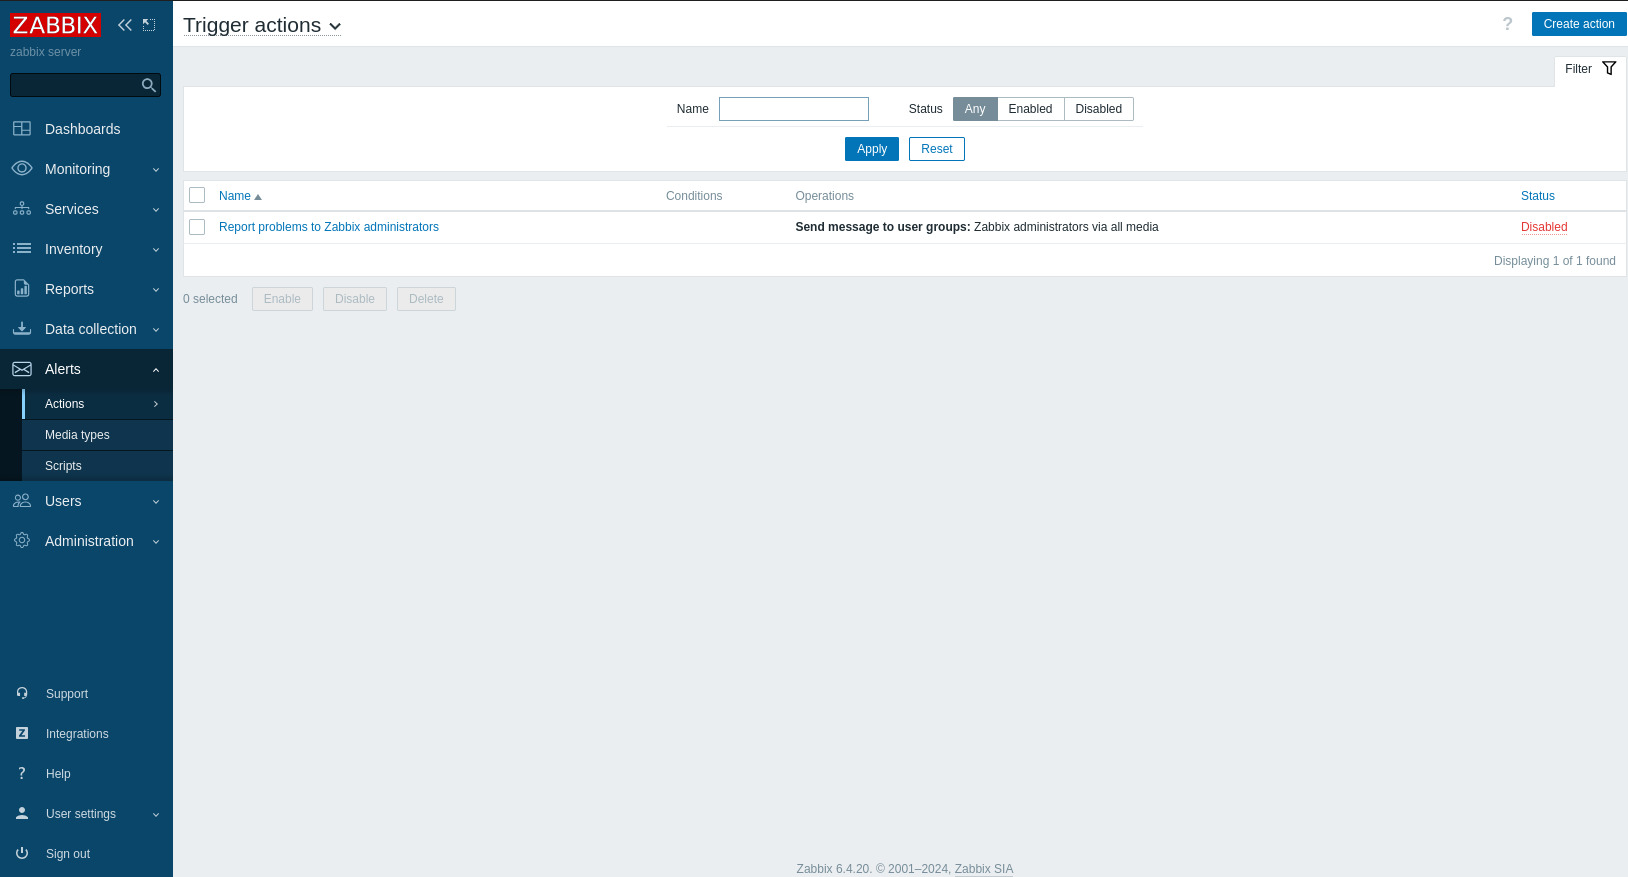
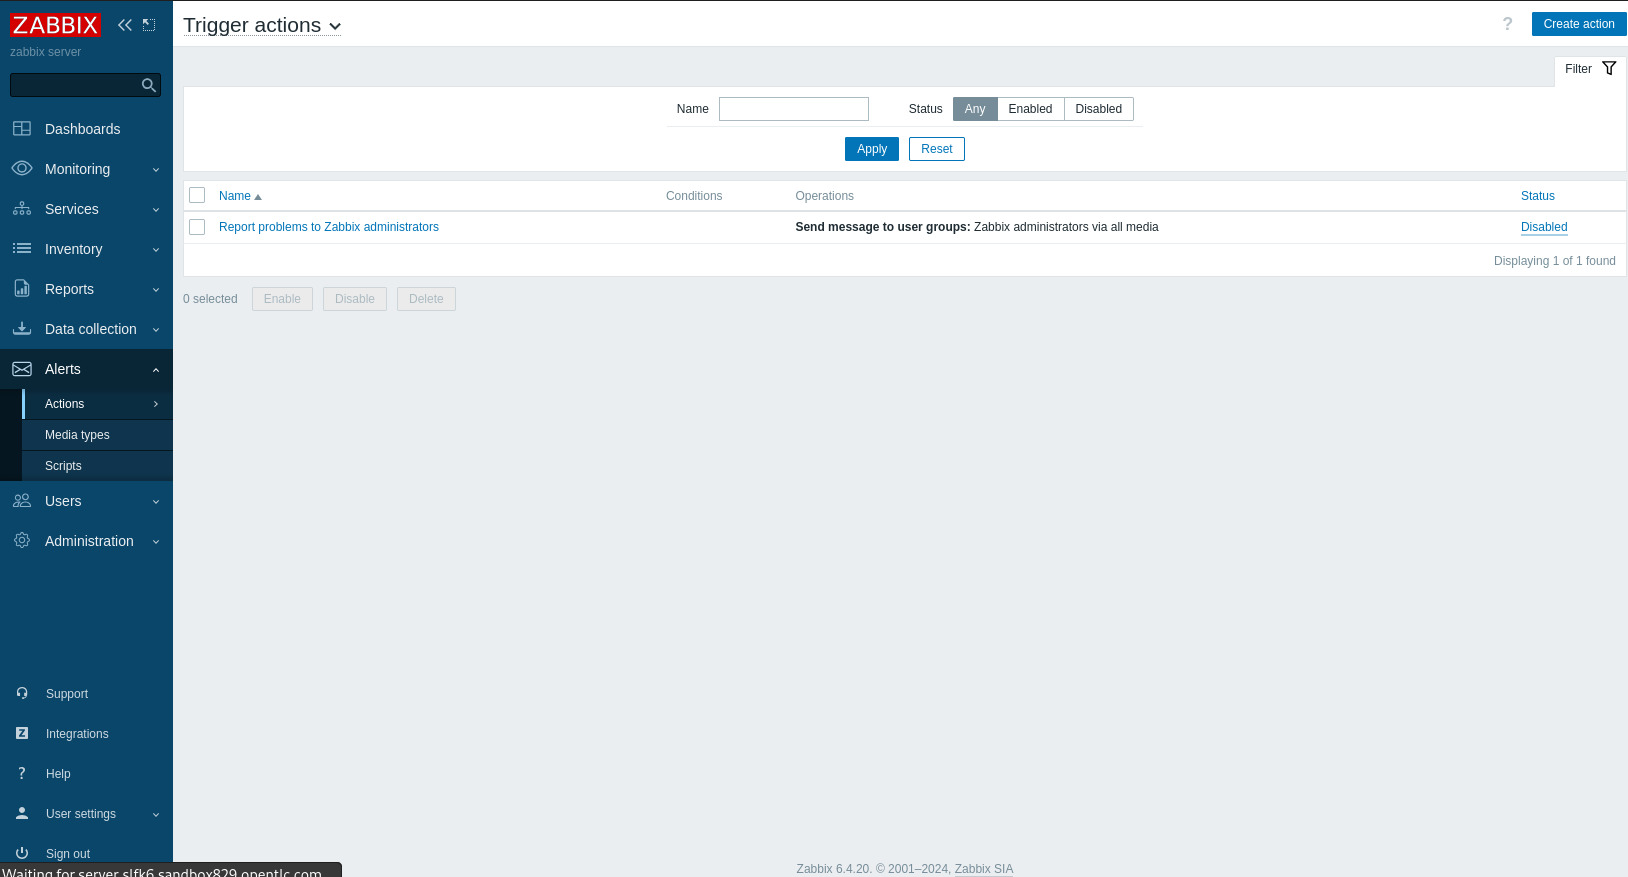
Next, configure Zabbix to send events to Event-Driven: Alerts > Actions > Trigger actions. For Enable Report problems to Zabbix administrators:, there is a "Disabled" link on the far right under the Status column that you need to click to Enable it. The following two screenshots show the before and after of changing this setting.
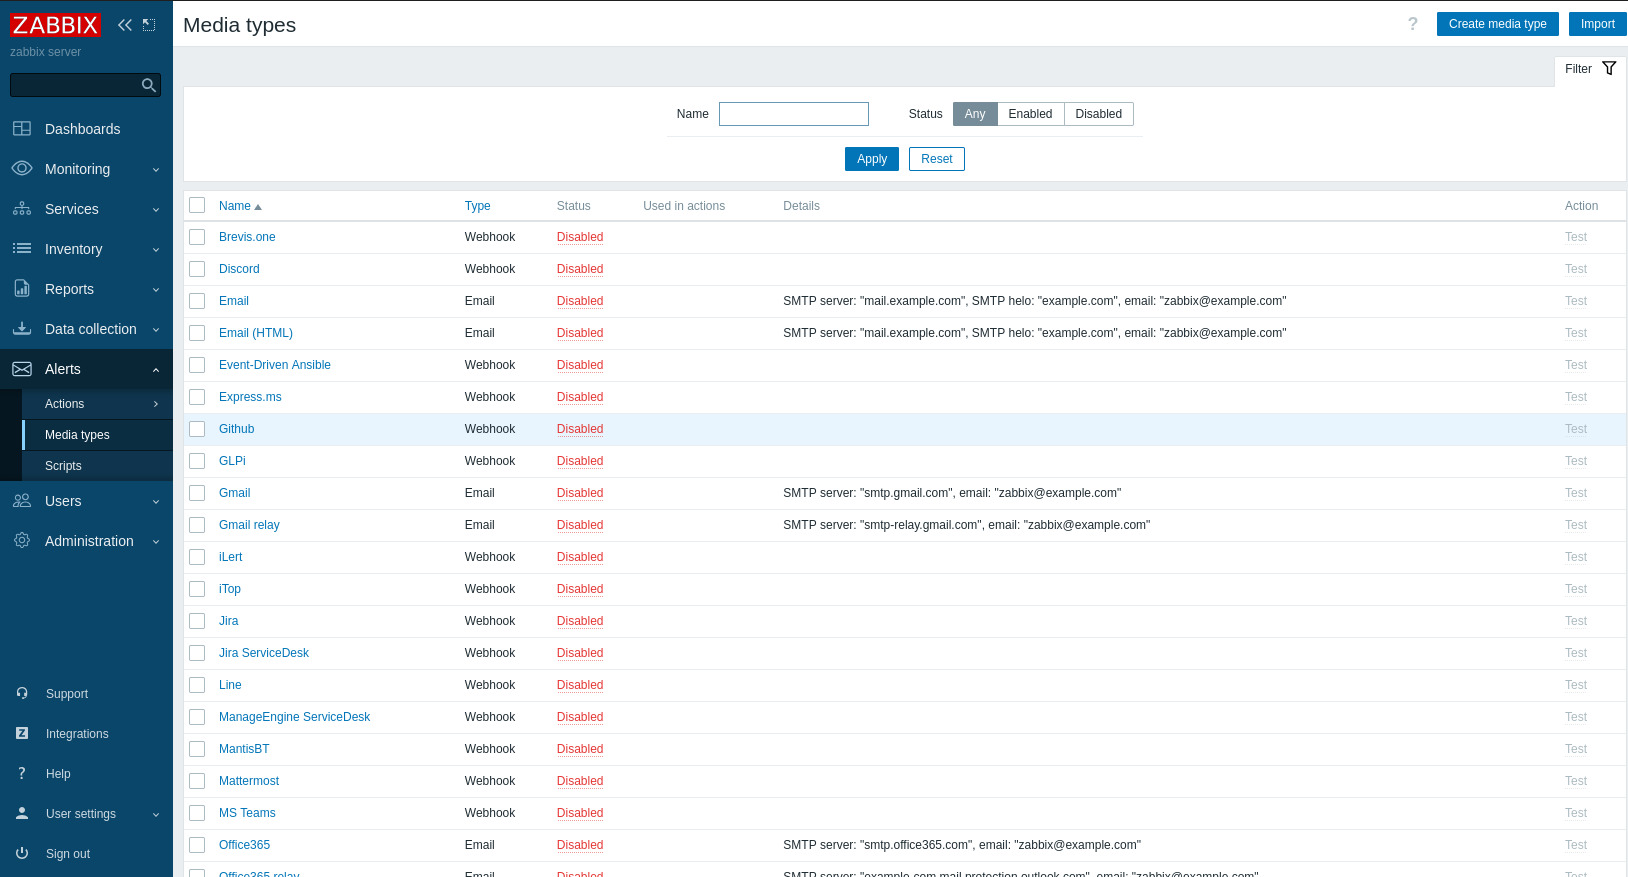
Let’s enable the Media Type:
. Click Disabled, and it will change to Enabled:
Now go to: .
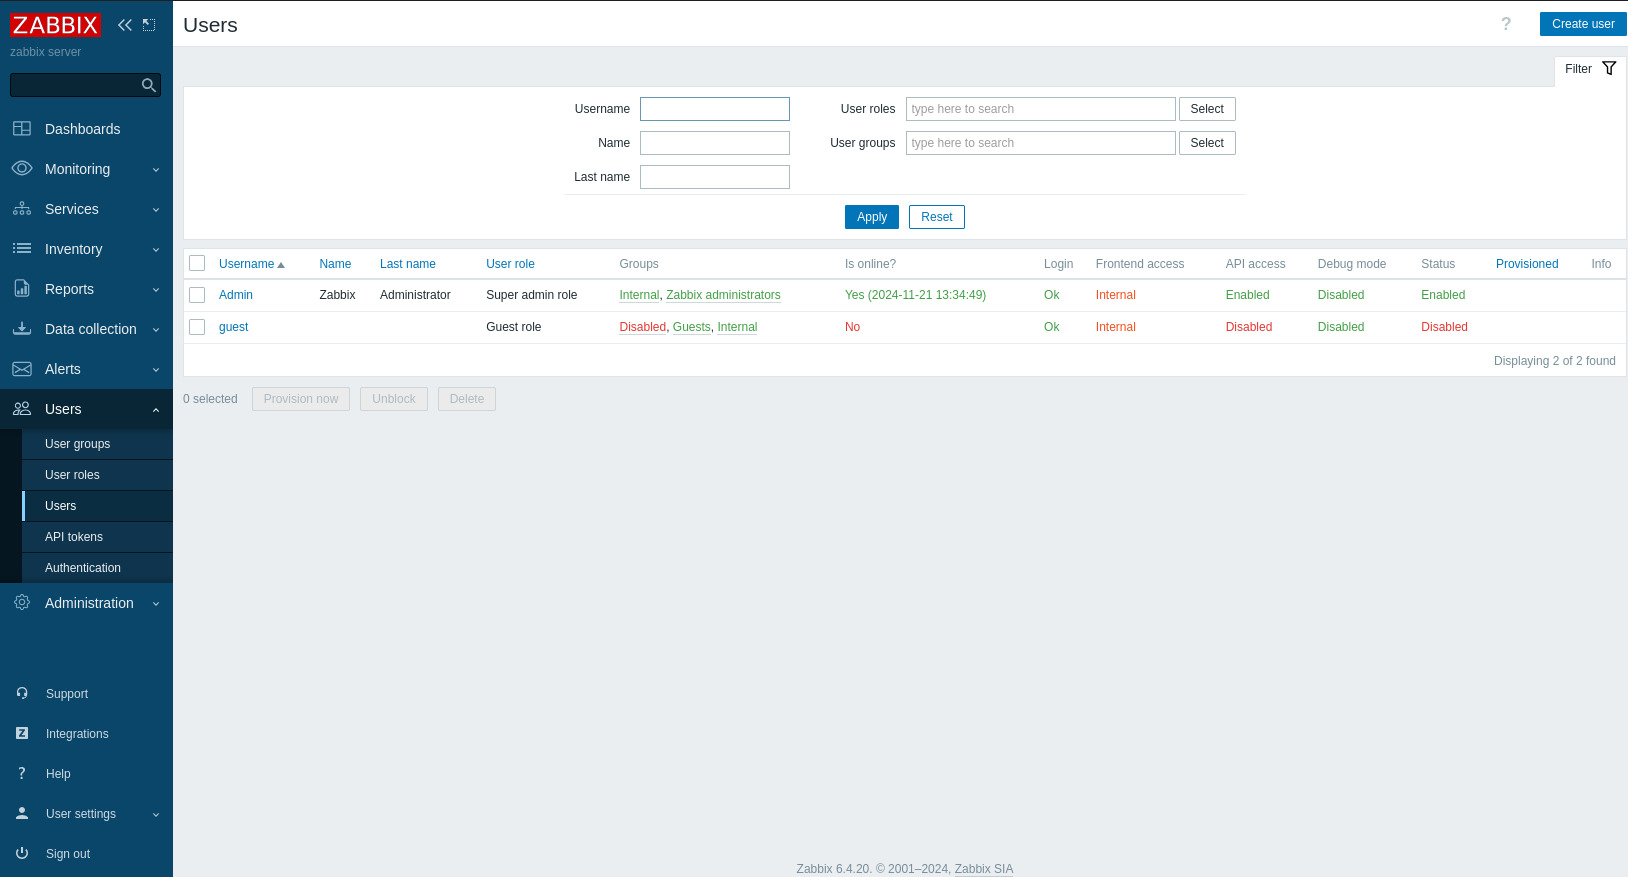
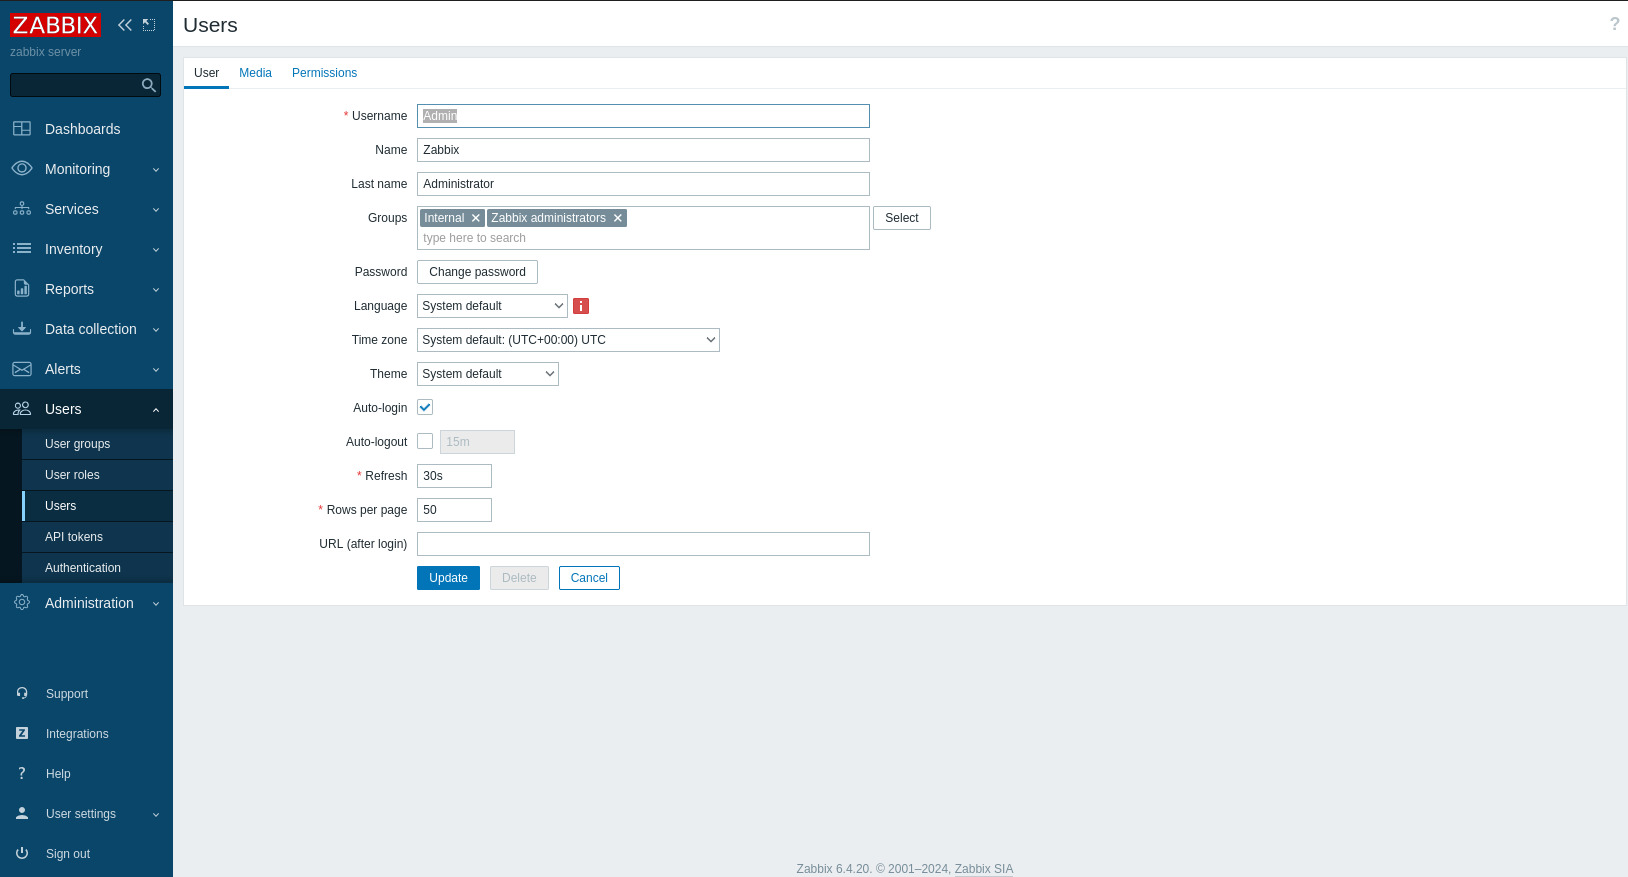
Click on the Admin user.
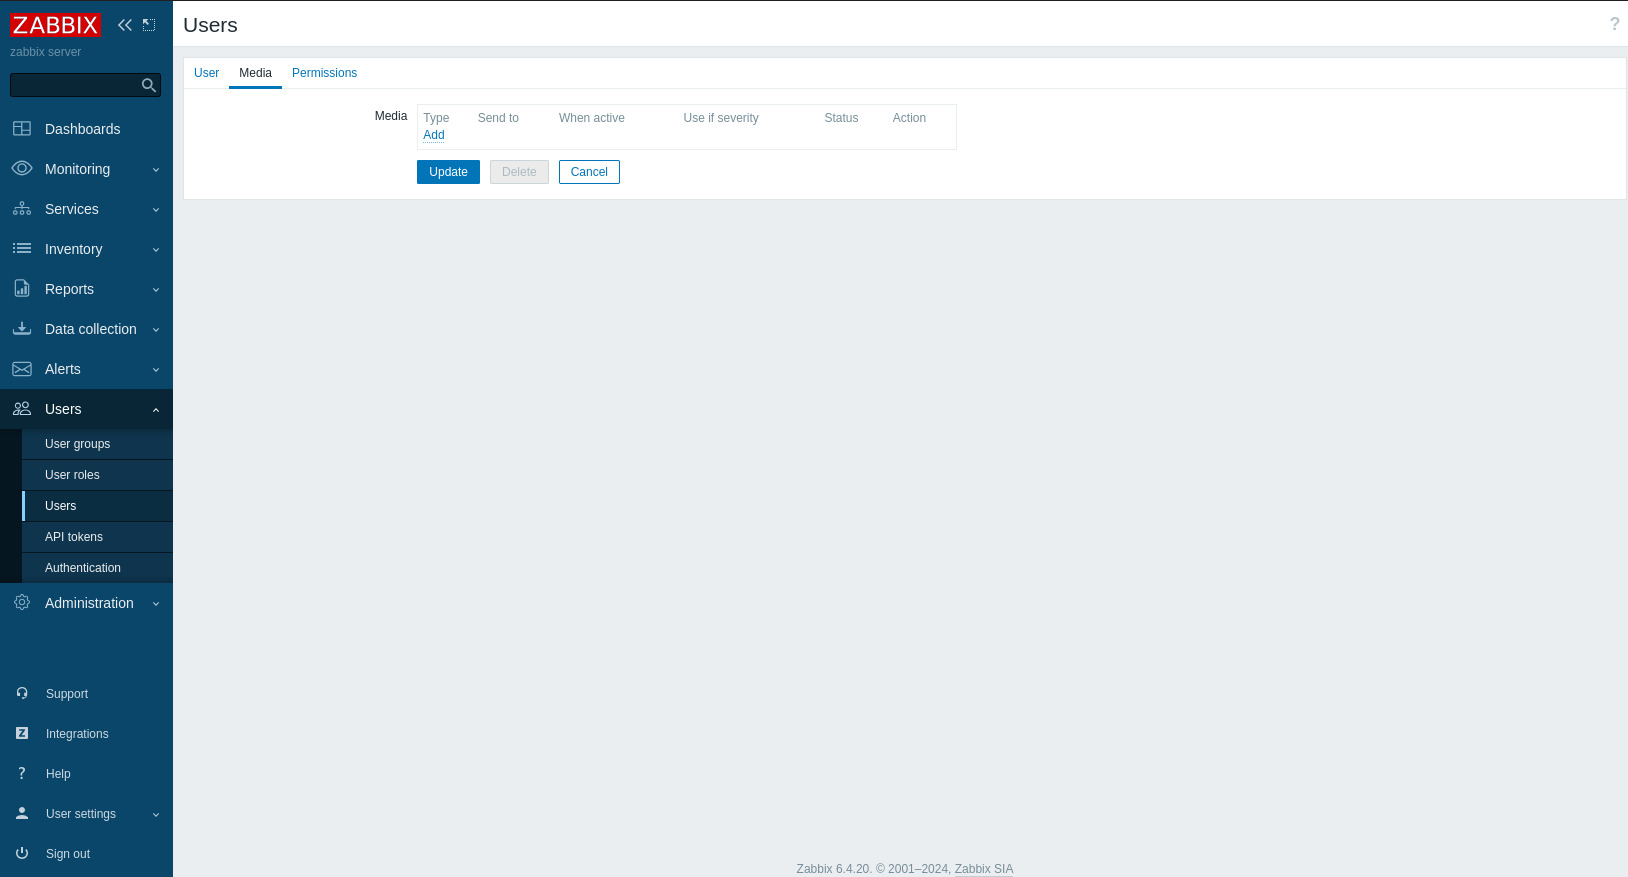
Click the Media tab on the top left:
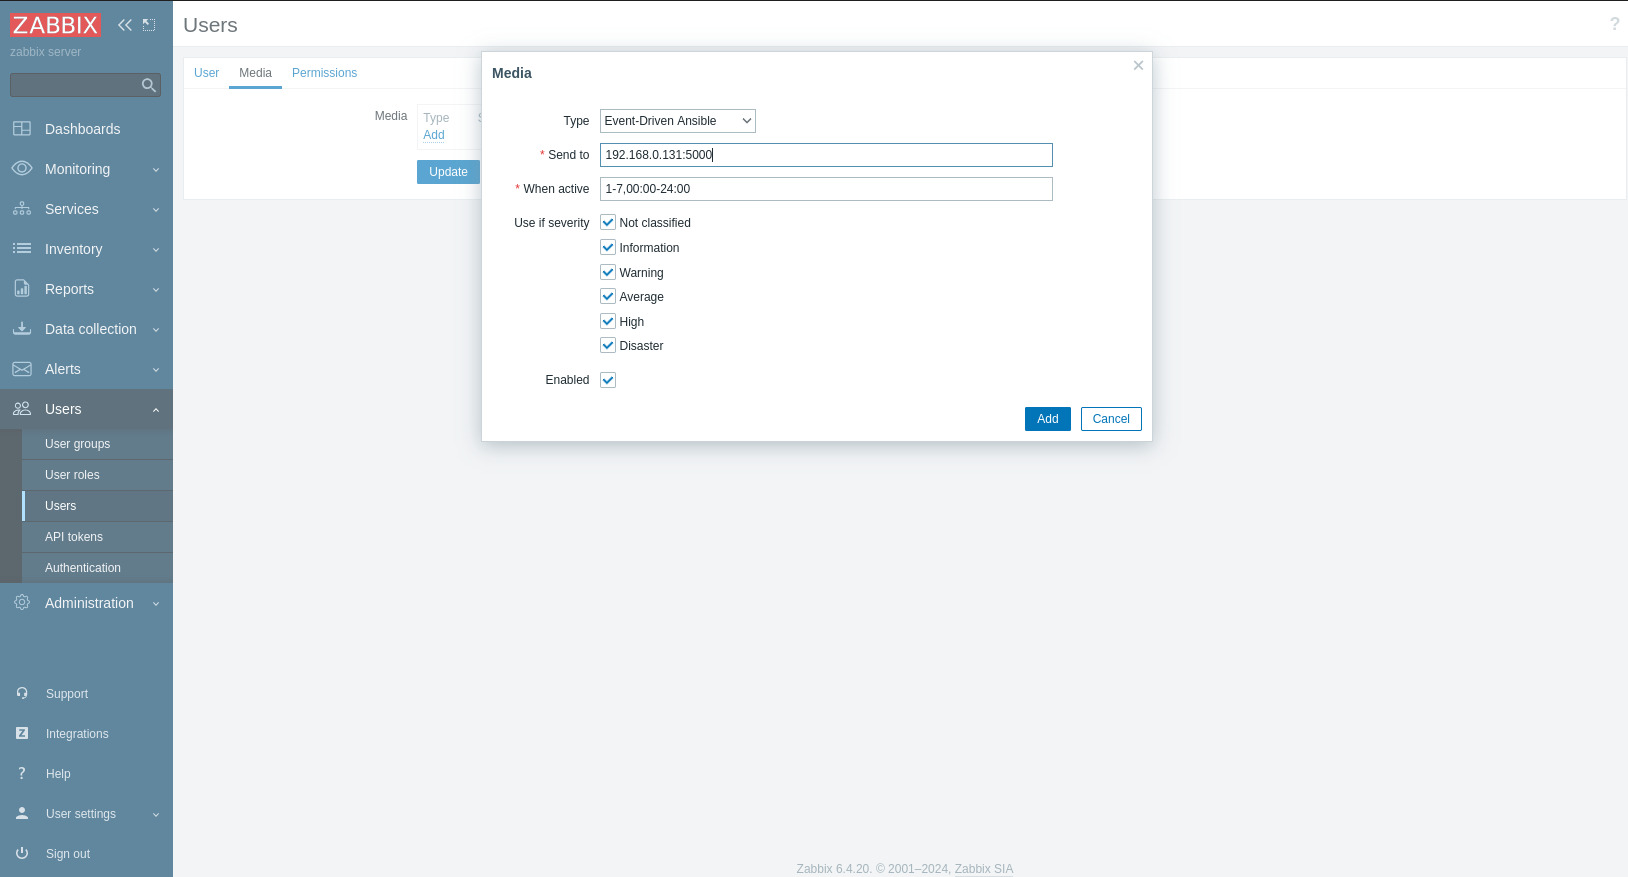
Add the (bold font) controller.example.com IP address. First, click Media, and then Add under Type:

To find the IP address, log in to the controller and run ip ad ls
[lab-user@bastion ~]$ ssh controller
Last login: Thu Nov 21 14:12:38 2024 from 192.168.0.144
[ec2-user@controller ~]$
[ec2-user@controller ~]$
[ec2-user@controller ~]$ ip ad ls
1: lo: <LOOPBACK,UP,LOWER_UP> mtu 65536 qdisc noqueue state UNKNOWN group default qlen 1000
    link/loopback 00:00:00:00:00:00 brd 00:00:00:00:00:00
    inet 127.0.0.1/8 scope host lo
       valid_lft forever preferred_lft forever
    inet6 ::1/128 scope host
       valid_lft forever preferred_lft forever
2: eth0: <BROADCAST,MULTICAST,UP,LOWER_UP> mtu 9001 qdisc mq state UP group default qlen 1000
    link/ether 02:ca:6e:57:61:5f brd ff:ff:ff:ff:ff:ff
    altname enp0s5
    altname ens5
    inet 192.168.0.131/24 brd 192.168.0.255 scope global dynamic noprefixroute eth0
       valid_lft 2868sec preferred_lft 2868sec
    inet6 fe80::ca:6eff:fe57:615f/64 scope link
       valid_lft forever preferred_lft forever
[ec2-user@controller ~]$
In this example the IP: 192.168.0.131:5000
Now add the IP of the controller and the Rulebook port of 5000 in the Send to field:
192.168.0.131:5000Now click Add
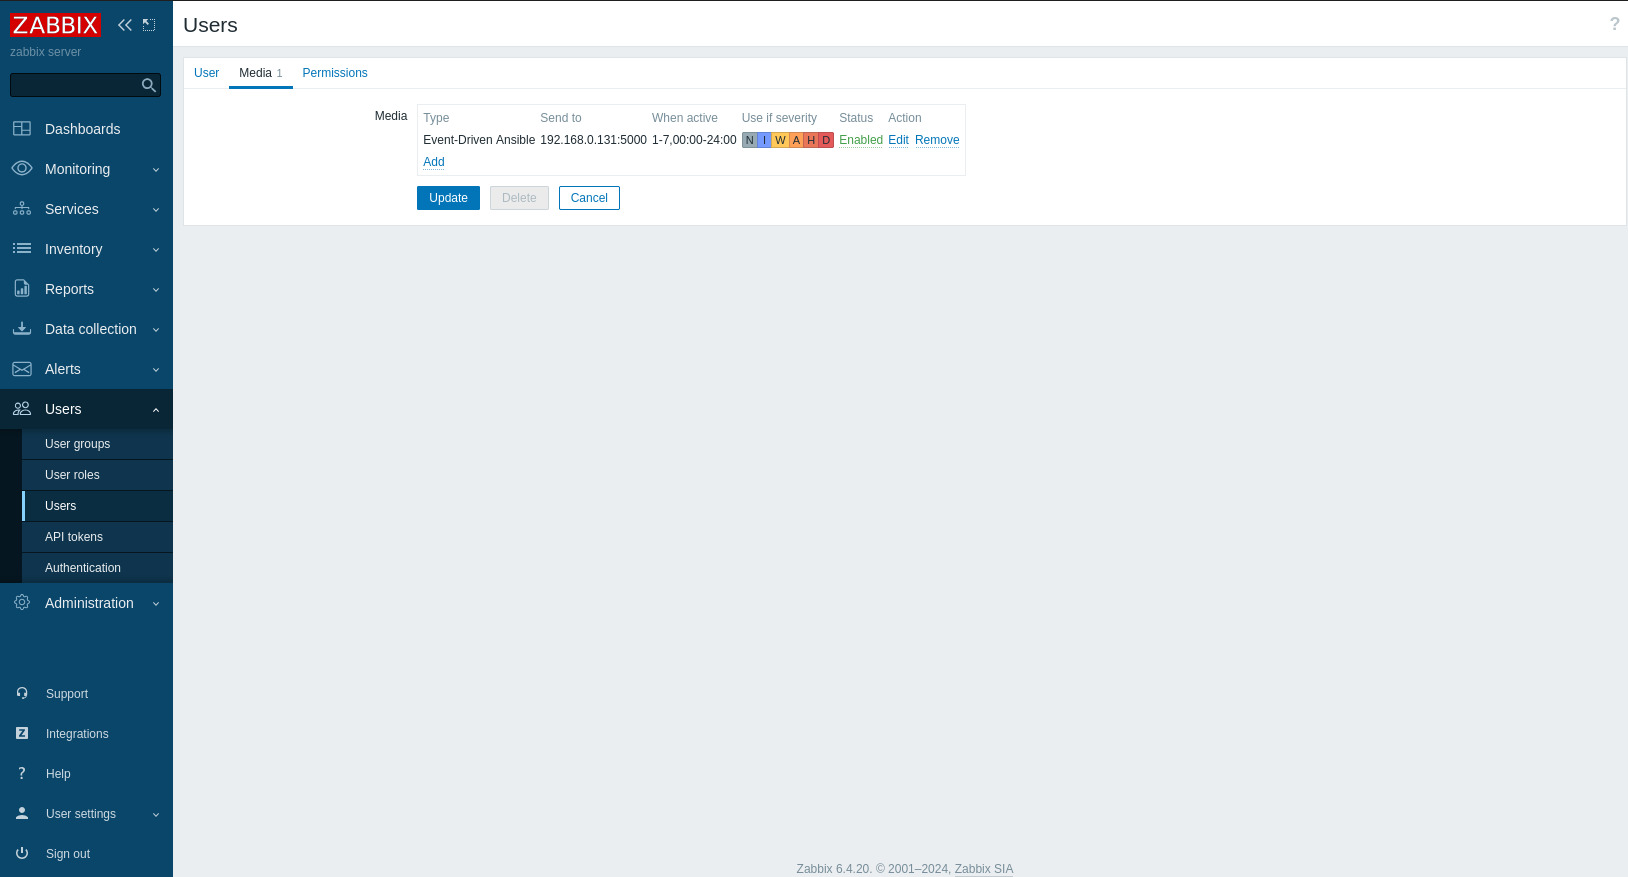
Click Update
Now Zabbix is monitoring node1. If there is any alert, it will be sent to Event-Driven.
From the terminal
cd ~/04-lab/
git clone git@server.example.com:root/eda-debug.git
cp -rf rulebooks eda-debug/
cd eda-debug/
git add . ; git commit -m add ; git push[ec2-user@node1 ~]$ cd 04-lab/ [ec2-user@node1 ~]$ git clone git@server.example.com:root/eda-debug.git [ec2-user@node1 04-lab]$ cp -rf rulebook eda-debug/ [ec2-user@node1 04-lab]$ cd eda-debug/ [ec2-user@node1 eda-debug]$ git add . ; git commit -m add ; git push
Next create the Rulebook in Automation Decisions to receive the Alerts:
From Ansible Automation Platform:
Open the URL if you need to: https://controller.{subdomain_base}/
Log in with the following credentials:
User: admin
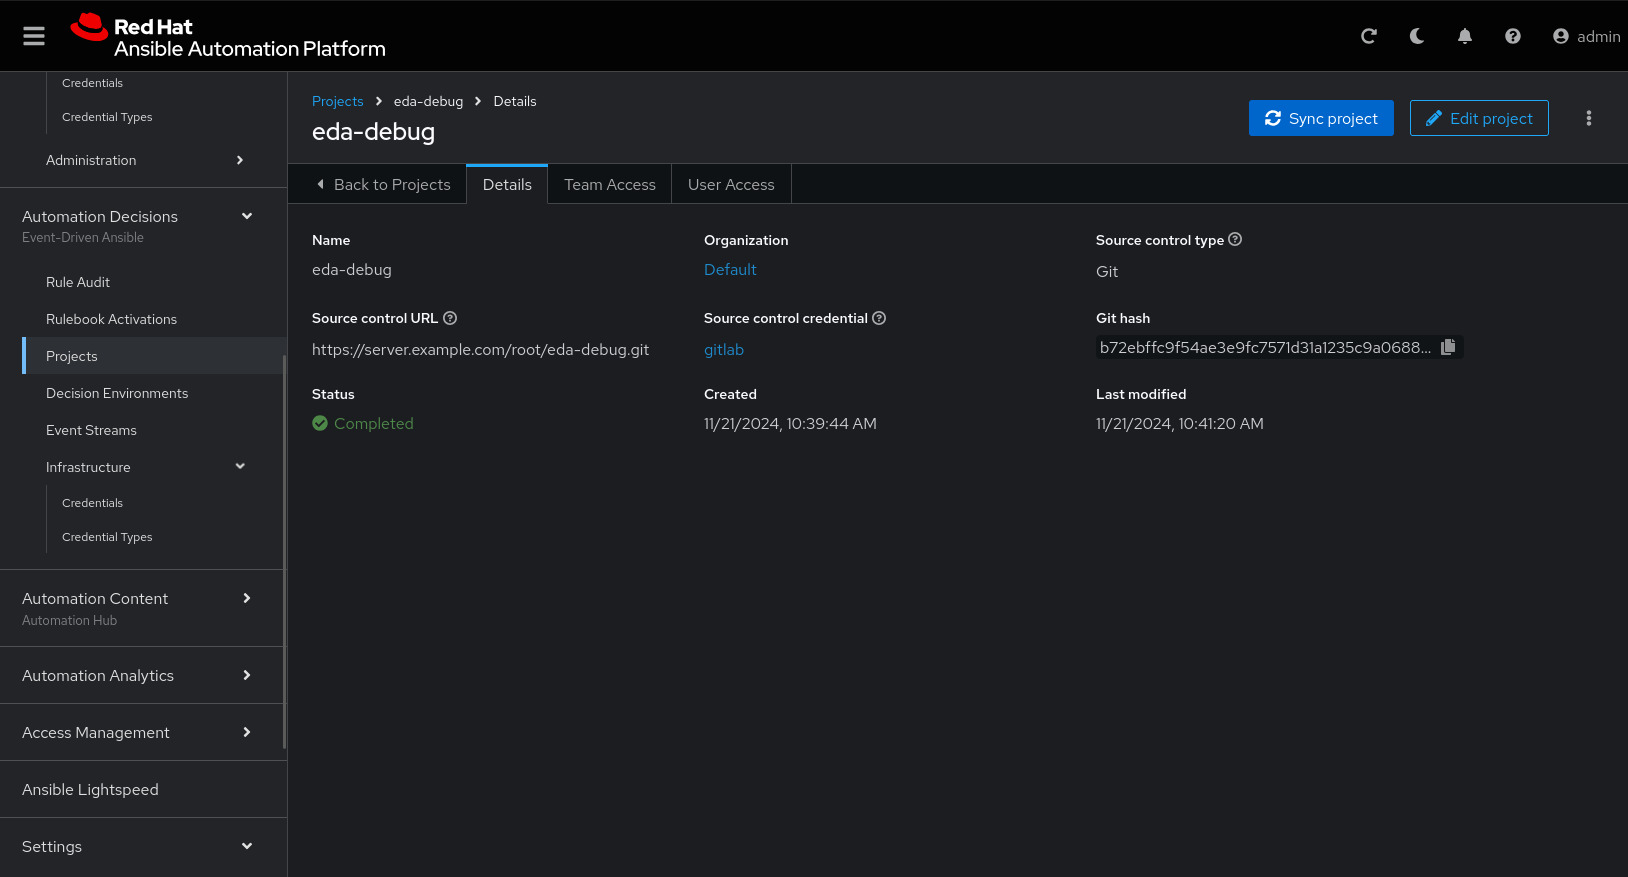
Pass: R3dh4t1!First, create the project in : Click Create project, create the project with the following information:
Name: eda-debug
Organization: Default
Source control type: Git
Source control URL: https://server.example.com/root/eda-debug.git
Source control credential: gitlab
Options: uncheck Verify SSL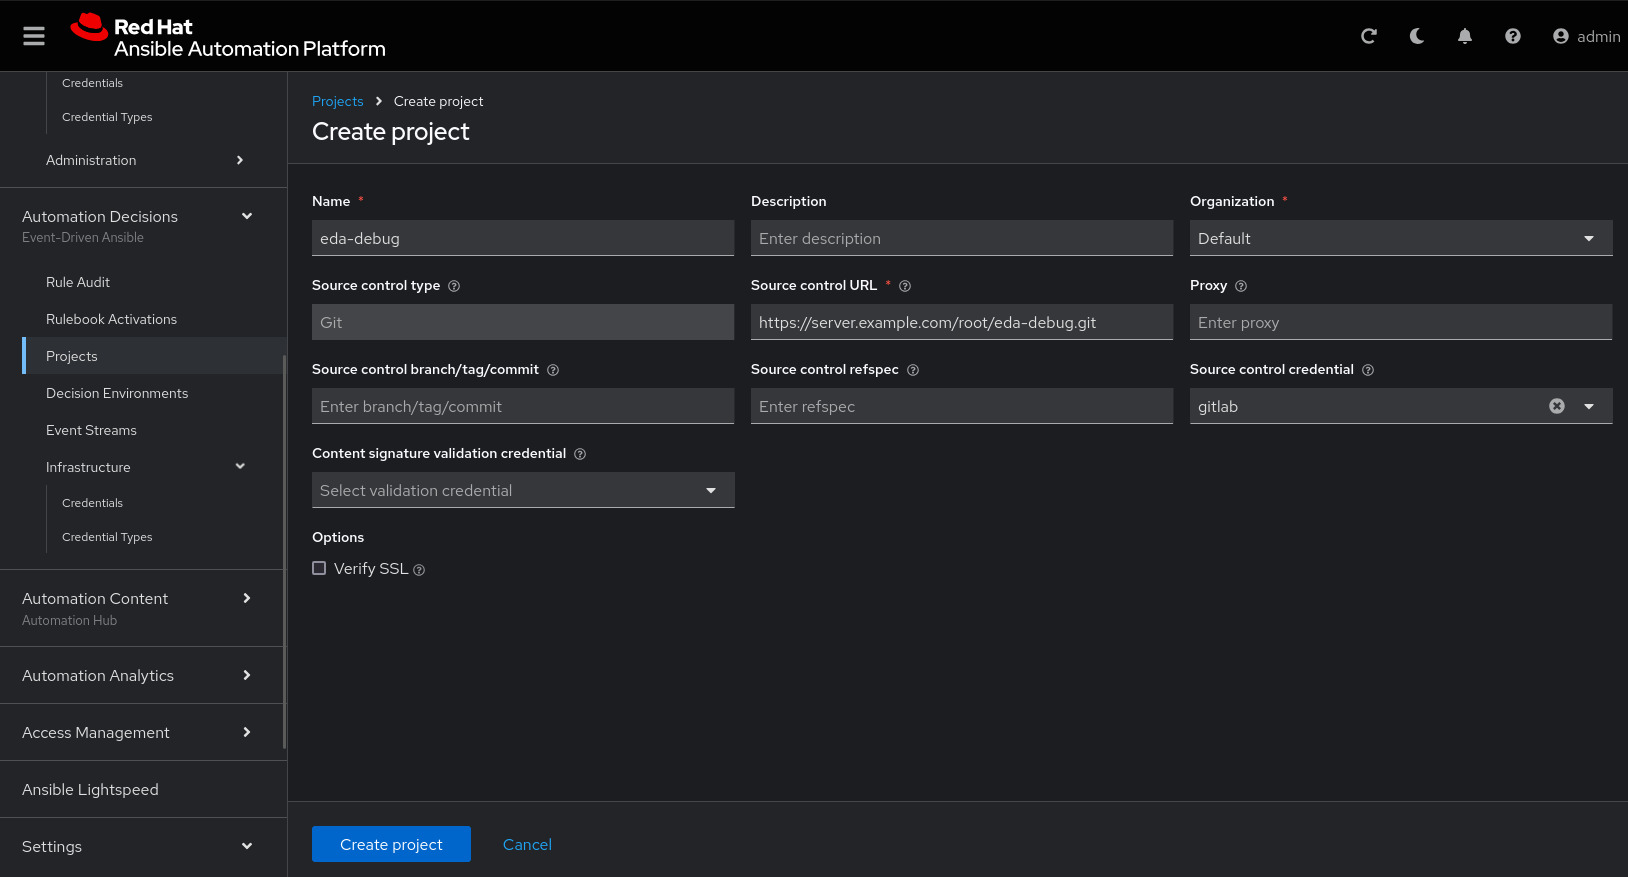
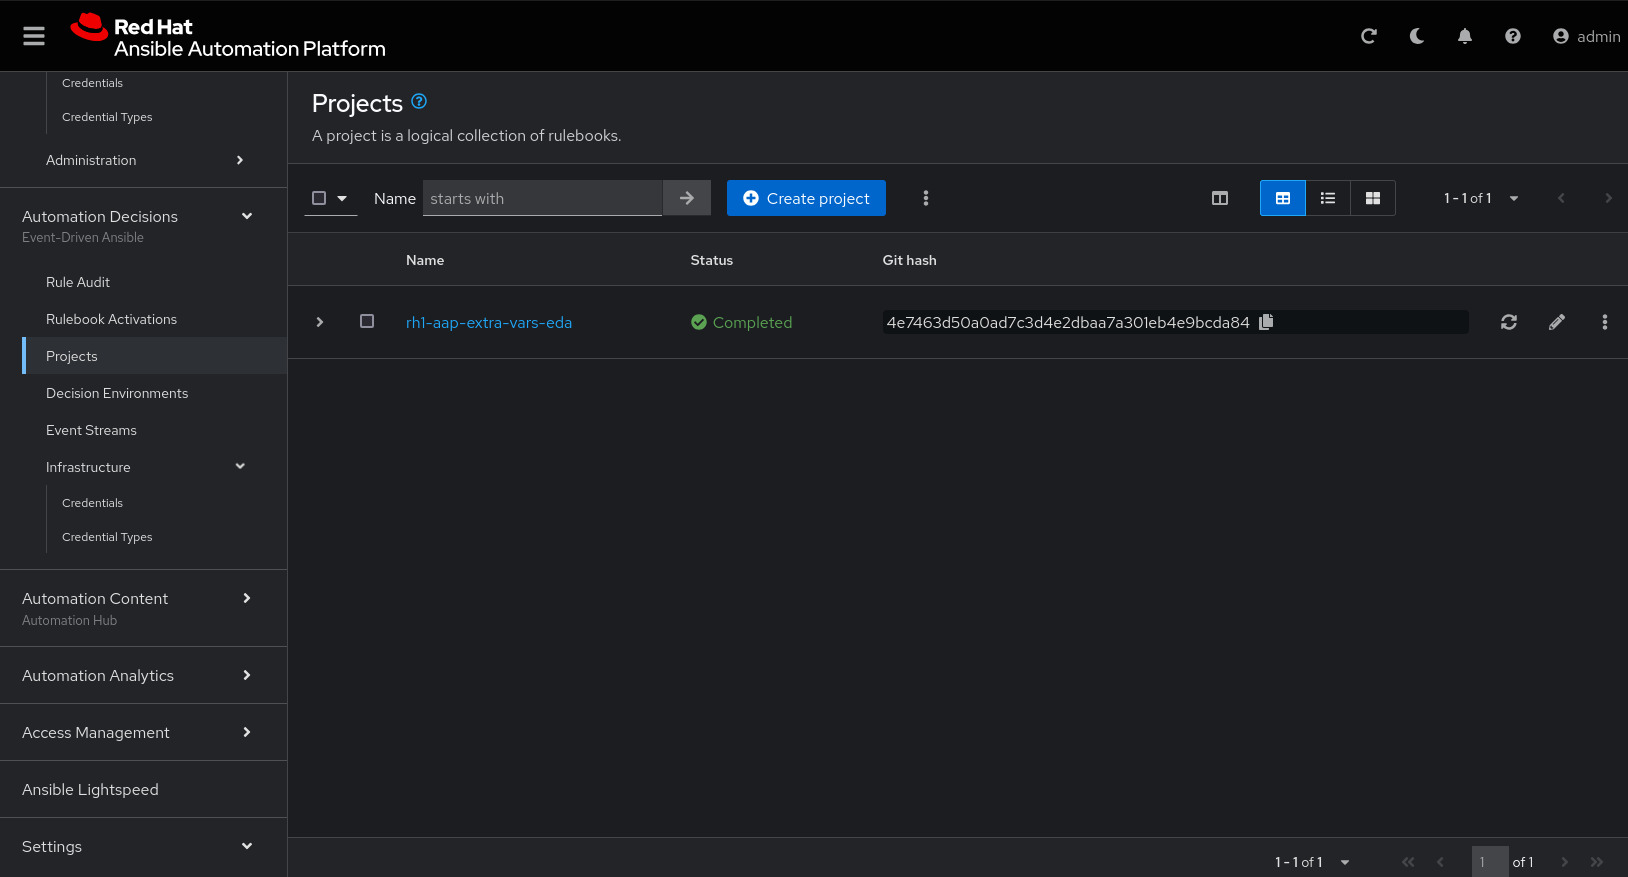
After you have created the project, it will sync successfully:
Create the rulebook:
Click on and then click Create rulebook activation:
Name: eda-debug
Organization: Default
Project: eda-debug
Rulebook: webhook-debug.yml
Credential: AAP
Decision environment: Default Decision Environment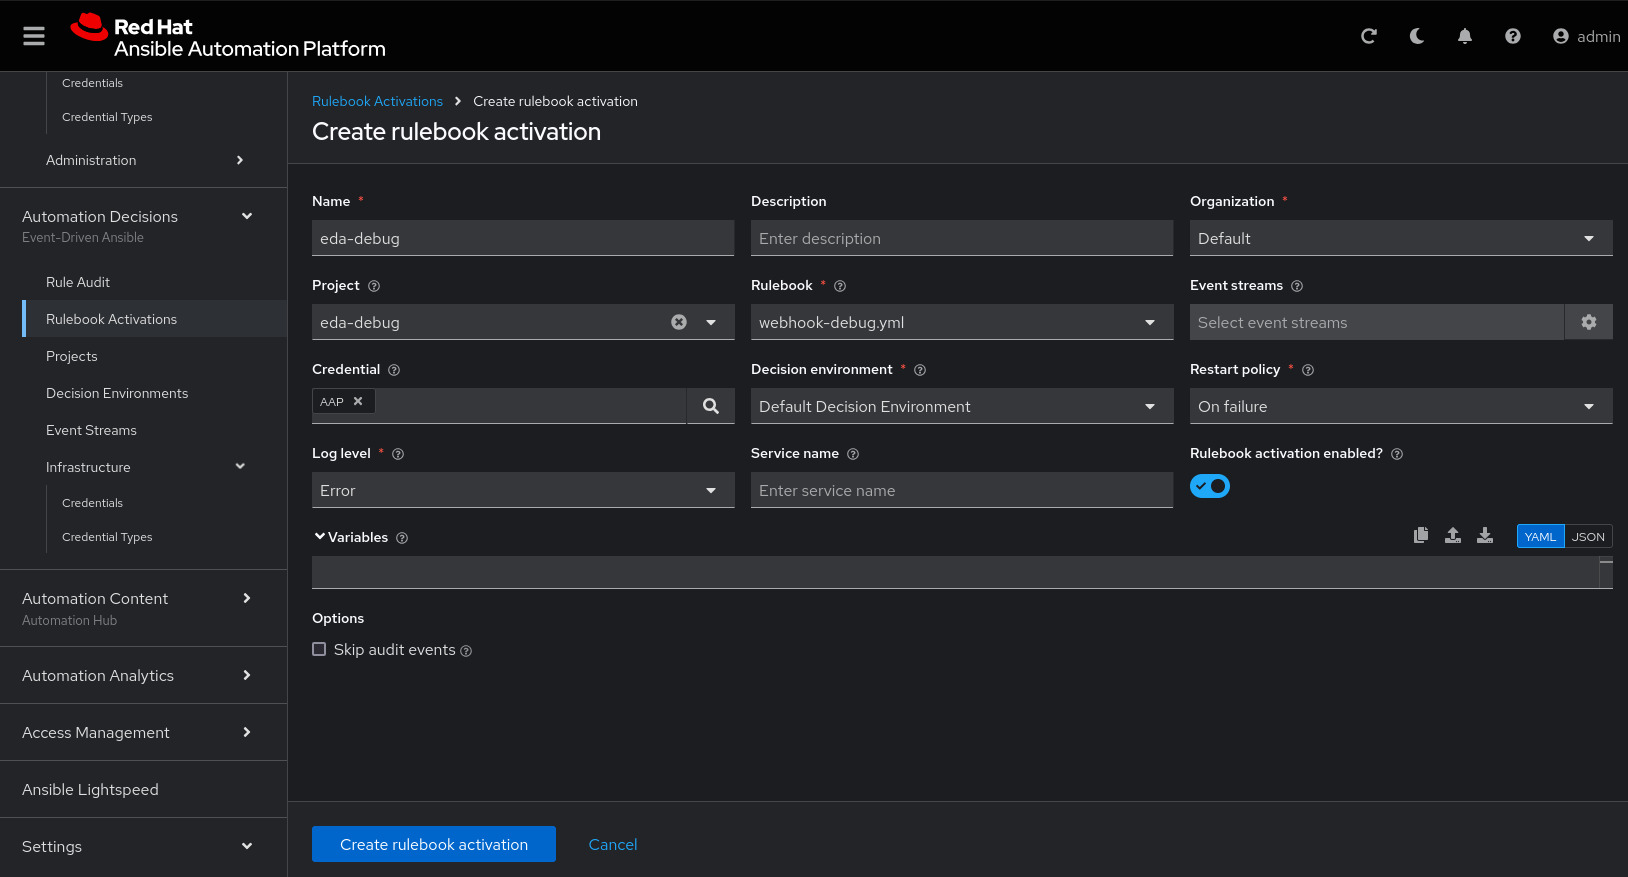
The rulebook will start:
Stop the apache service for the alert to be sent to Event-Driven.
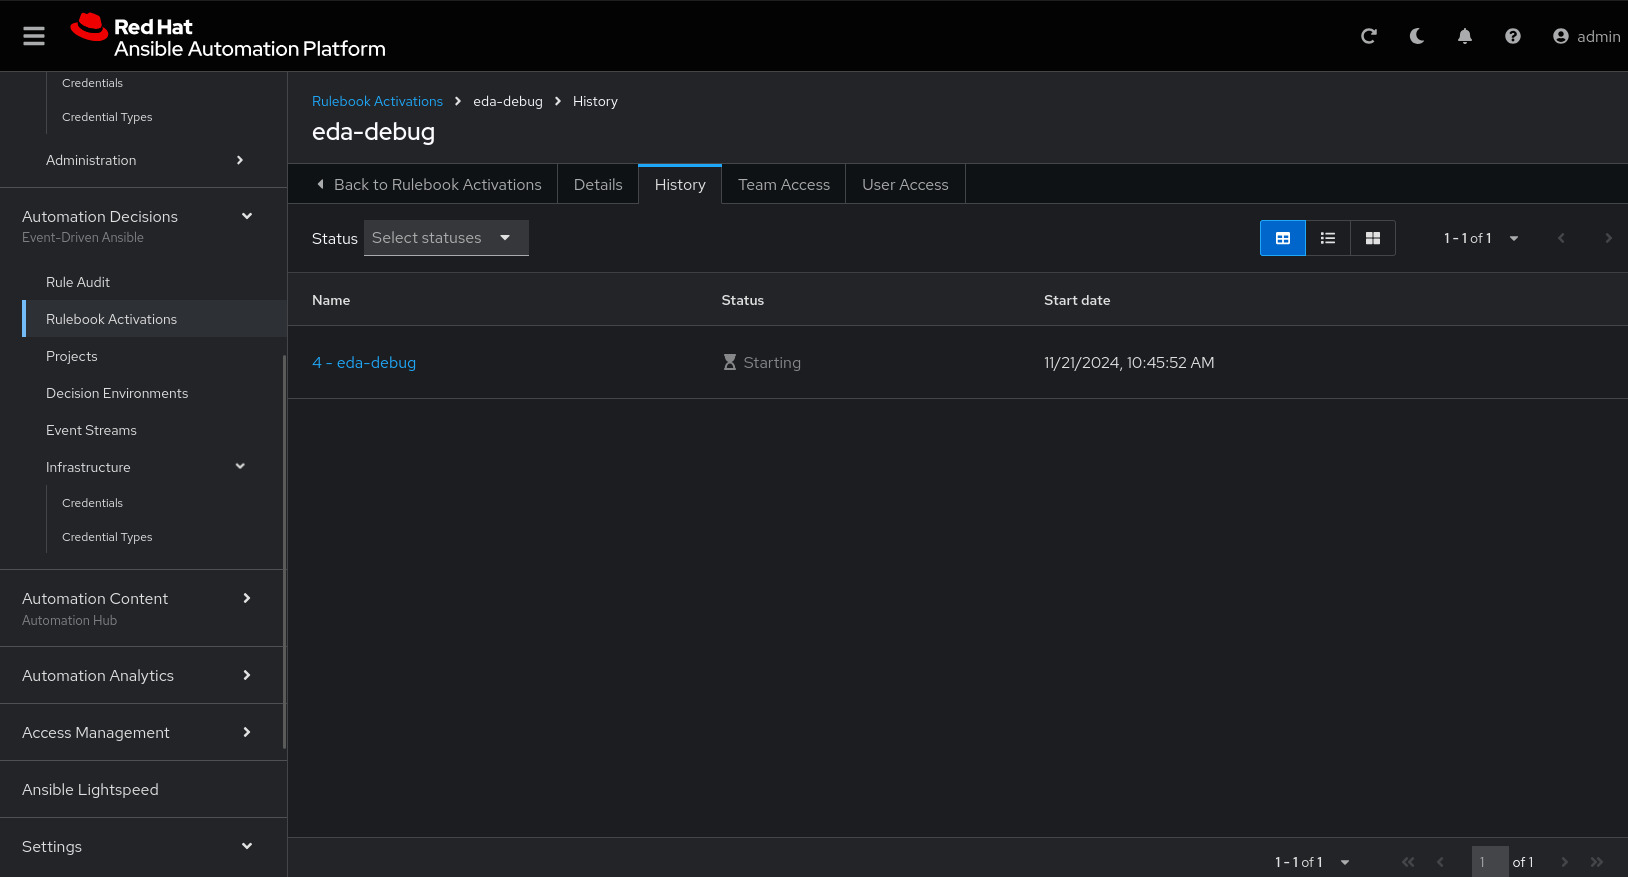
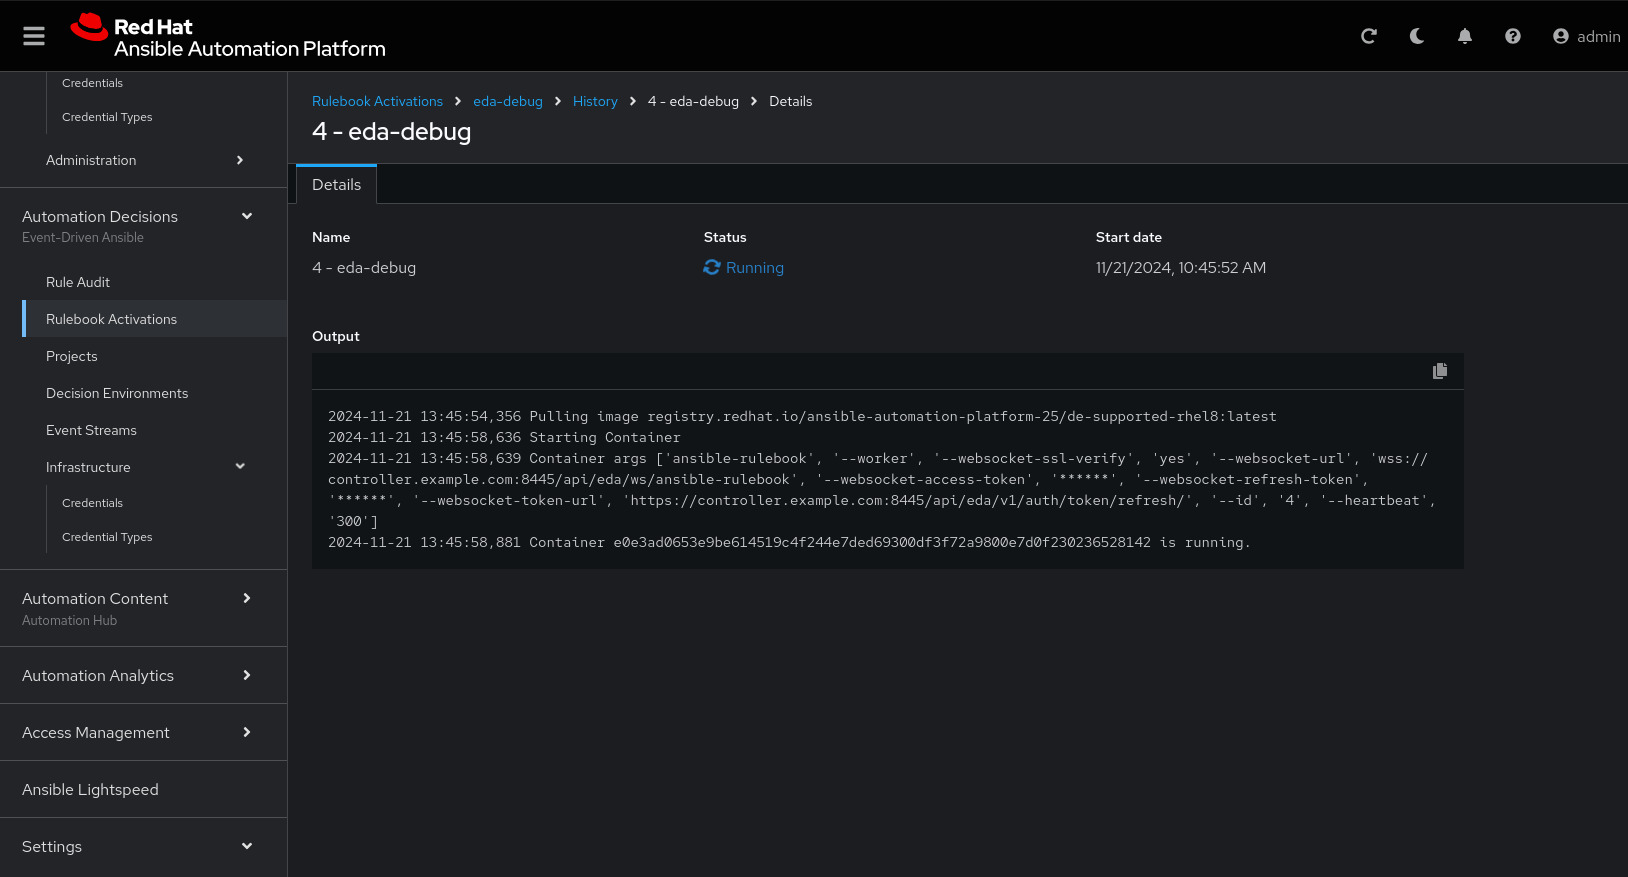
Click the rulebook name: eda-debug
Click on History:
Access the node1 terminal and stop the Apache service:
ssh node1
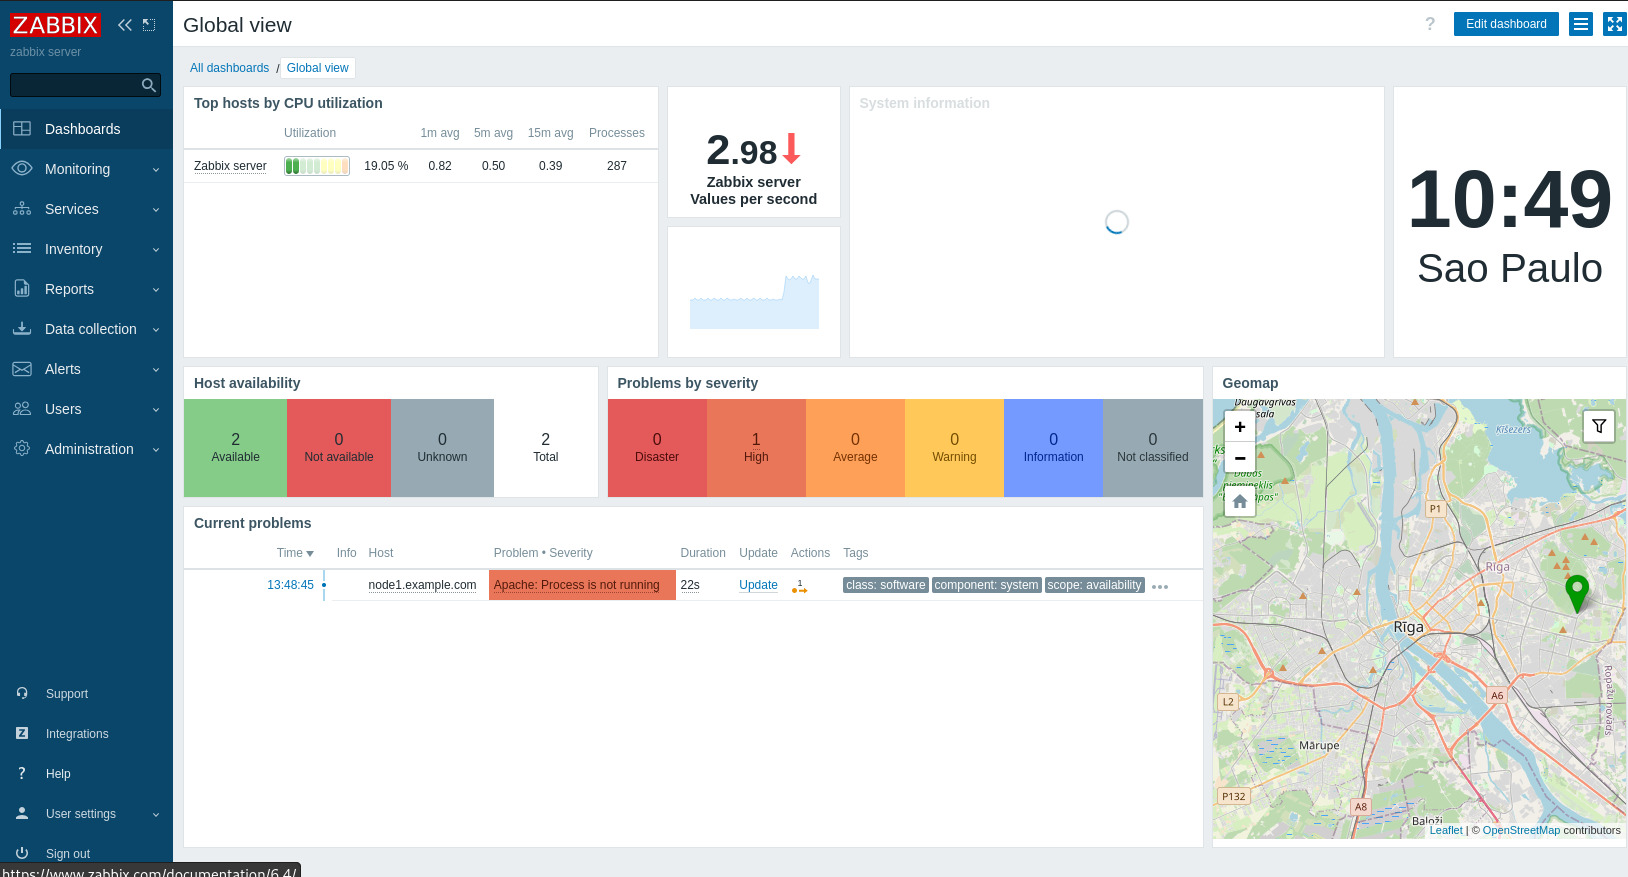
sudo systemctl stop httpdIn the Zabbix Dashboards
We will be able to see the Apache alert being sent to Event-Driven on the Zabbix dashboard:
| It takes about 30 seconds and a browser refresh to show it under Actions. |
| The red line under Actions in the Current Problems section. This is a failure you must clear. |
Restart httpd in the node1 terminal and clear the error before moving on.
ssh node1
sudo systemctl start httpd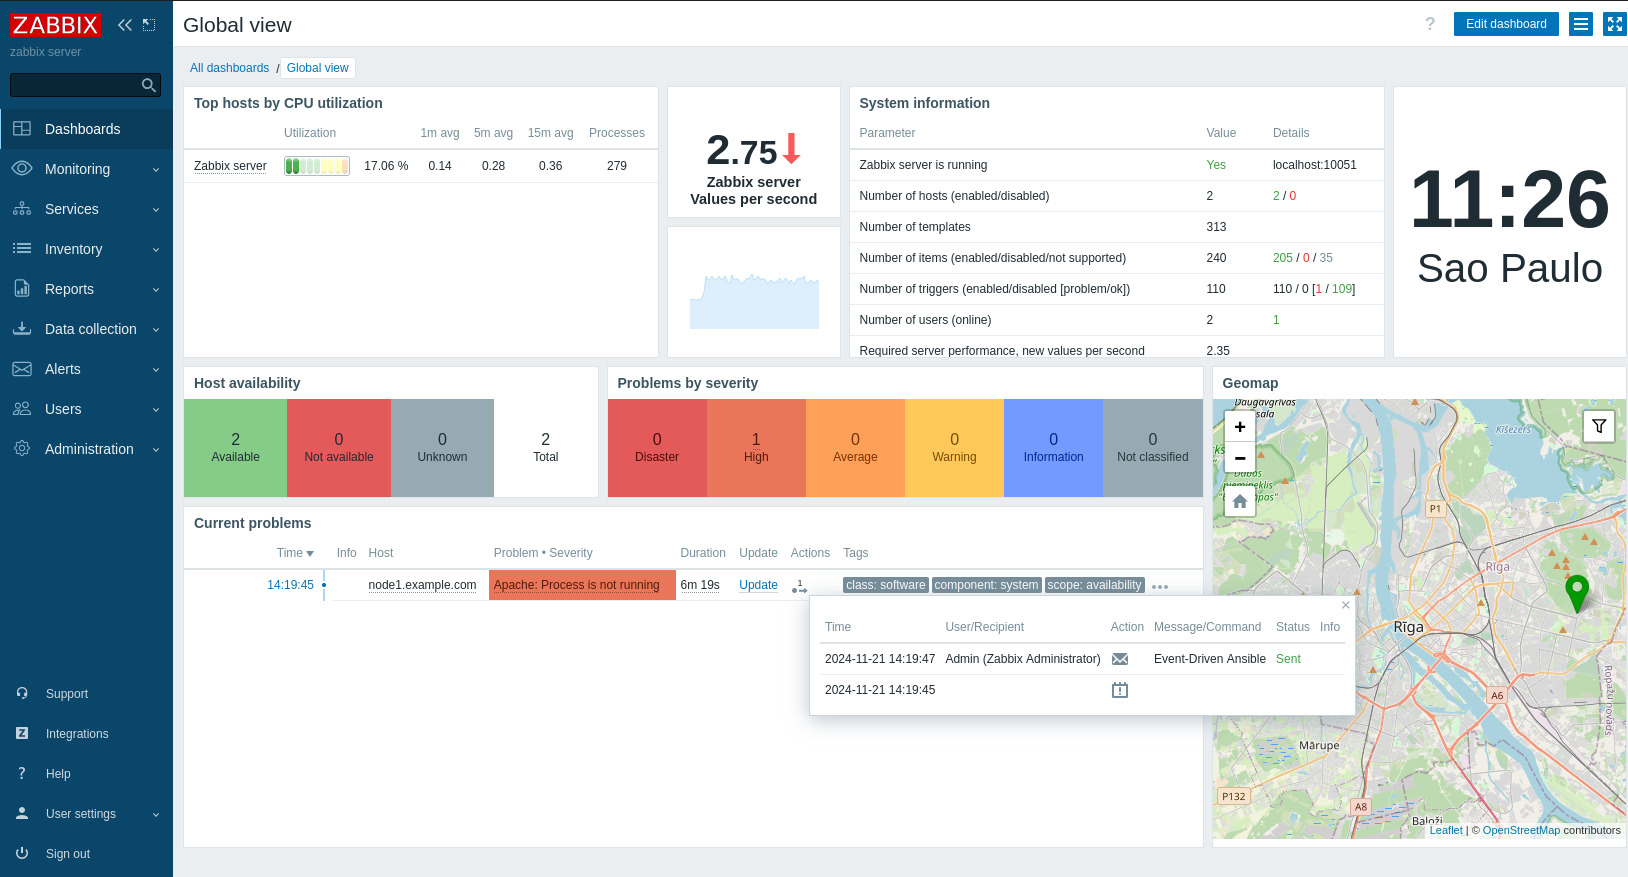
In Event-Driven we can see the playload arriving.
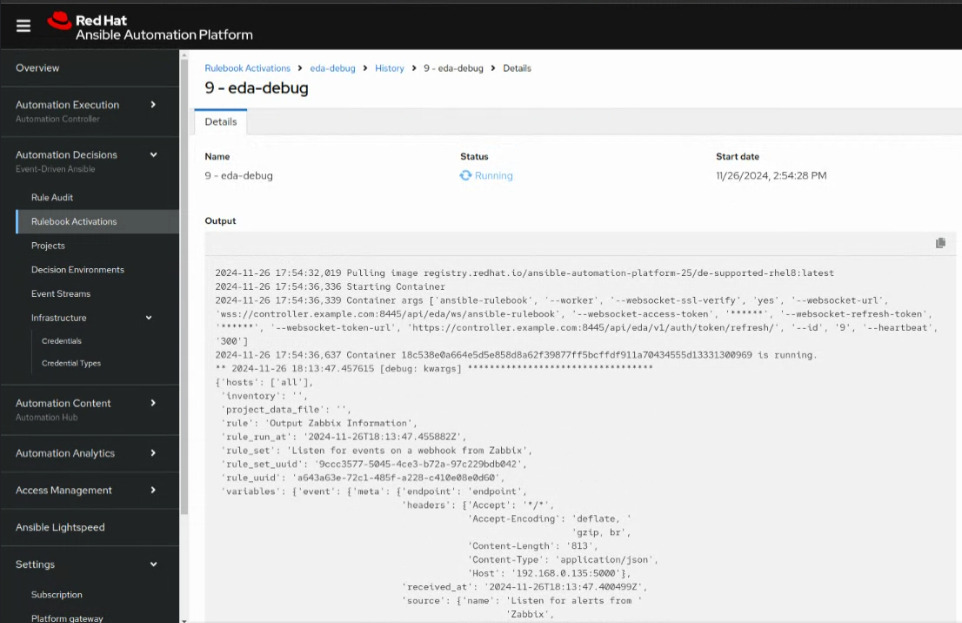
{'hosts': ['all'],
 'inventory': '',
 'project_data_file': '',
 'rule': 'Output Zabbix Information',
 'rule_run_at': '2024-11-26T18:13:47.455882Z',
 'rule_set': 'Listen for events on a webhook from Zabbix',
 'rule_set_uuid': '9ccc3577-5045-4ce3-b72a-97c229bdb042',
 'rule_uuid': 'a643a63e-72c1-485f-a228-c410e08e0d60',
 'variables': {'event': {'meta': {'endpoint': 'endpoint',
                                  'headers': {'Accept': '*/*',
                                              'Accept-Encoding': 'deflate, '
                                                                 'gzip, br',
                                              'Content-Length': '813',
                                              'Content-Type': 'application/json',
                                              'Host': '192.168.0.135:5000'},
                                  'received_at': '2024-11-26T18:13:47.400499Z',
                                  'source': {'name': 'Listen for alerts from '
                                                     'Zabbix',
                                             'type': 'ansible.eda.webhook'},
                                  'uuid': 'dc3d7651-c374-4a95-9169-73e5f269db33'},
                         'payload': {'HTTPProxy': '',
                                     'acknowledged': 'No',
                                     'endpoint': '/endpoint',
                                     'event_date': '2024.11.26',
                                     'event_datetime_timestamp': 1732644824,
                                     'event_id': 110,
                                     'event_name': 'Apache: Service is down',
                                     'event_nseverity': 3,
                                     'event_object': 0,
                                     'event_severity': 'Average',
                                     'event_source': 0,
                                     'event_tags': {'class': ['software'],
                                                    'component': ['application',
                                                                  'health',
                                                                  'system'],
                                                    'scope': ['availability'],
                                                    'target': ['apache']},
                                     'event_time': '18:13:44',
                                     'event_value': 1,
                                     'host_groups': ['Applications'],
                                     'host_host': 'node1.example.com',
                                     'host_id': 10631,
                                     'host_ip': '127.0.0.1',
                                     'host_port': '10050',
                                     'monitoring_source': 'Zabbix sever',
                                     'operation_data': 'Down (0), 0',
                                     'send_to': '192.168.0.135:5000',
                                     'subject': 'Event ID: 110, Host: '
                                                'node1.example.com, Problem: '
                                                'Apache: Service is down',
                                     'trigger_description': '',
                                     'trigger_id': 23758,
                                     'trigger_name': 'Apache: Service is '
                                                     'down'}}}}
********************************************************************************
PAUSE
Solution Hint
| If your configuration was successful you will receive the message below during playback. |
 'event_name': 'Apache: Service is down',
 'host_host': 'node1.example.com',
In the next lab, we will customize the rulebook to take this event_name as a condition!
We will use this payload to solve the apache problem.